
Integration of models PowerPoint PPT Presentation
1 / 50
Title: Integration of models
1
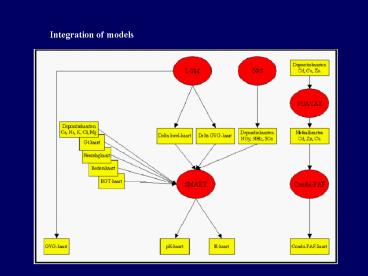
Integration of models
2
Integration of models
- There basically are three ways to integrate
models - Separate calculations, visualize linkage by mind
power - Computerized linking of input and output
- As objects within a modeling environment
3
Linking of input / output
Loosely coupled models
M1
M2
GIS
M3
4
Loosely coupled models Data is being converted
many times
GIS
Database
Manipulation
Import export
MODEL
CALC
5
Linking of input / output
Tightly coupled models
M1
M2
GIS
M3
6
Tightly coupled models The model environment
calls directly to the numerical engine
GIS
Database
Manipulation
MODEL
CALC
7
Embedded models
Embedded in the modeling environment as an
object
Procedure
M1
M2
M3
GIS
8
Example of an embedded model hydrochemistry
A simple model to estimate nutrient fluxes in a
river network (de Wit, 1999)
The model is GIS based L nutrient load DE
direct effluent SSS surplus on soil surface a
inverse decay in stream b leaching to streams
9
Example hydrochemistry
Fast and efficient because it can use special
hydrological functions built within the GIS
(PCRaster)
10
GIS
Example hydrology
P
AET
People
Effluent
Embedded models within a GIS-based procedure
Soil /
vegetation
Direct runoff
Percolation
Capillary
Phreatic
Groundwater
Baseflow
MODFLOW
Regional
Groundwater
Transfer to other
catchments
Routing in a
catchment by an
LDD
11
Example hydrology
Some examples of embedded models
Soil water balance
Capillary rise
12
Example hydrology
13
Integration of models
- Integration of models means
- more parameters
- more data
- reduced transparency
14
Integration of models overall parameter trains
may cause a parameter crisis
15
Integration of models
Example of complex model trains
16
Integration of models
Example of complex model trains
17
Integration of models
- What complexity is warranted ?
- what is the purpose of modeling
- what is the required spatial resolution?
- what is the size of the area?
- how many processes should be modeled?
18
What is the purpose of the model?
- predictions in service of informing a decision
- Improving datasets and models
- for the benefit of scientific advance
19
What is the size of the area?
- Increasing size
- more human activities
- more variety (soils, activities, ecosystems)
- ? More data!
20
What is the required spatial resolution?
Data needed
Increasing spatial resolution
21
How many processes should be modeled?
General the more complex (the more processes are
included), the better the model BUT Increasing
the complexity of a model, may also increase the
error (van der Perk and De Wit )
22
How many processes should be modelled?
23
- Rules of thumb
- Decision purposes
- large areas, low level of detail, simple models
- scientific purposes
- -small areas, high level of detail, complex
models - BUT a model should be adequate
24
Adequacy 1. The model error should be smaller
than the tolerance of ecosystems
habitat factor
Tolerance of ecosystem
1
2
3
25
Adequacy 2. the model should be able to bring
predictions near the optimum of the ecosystem
habitat factor
Tolerance of ecosystem
1
2
3
26
- What are common errors?
- Input data (wrong samples, no representative
data, interpolation errors etc.) - Calibration data (wrong samples, measurement
errors) - The model (wrong estimators, wrong concept, etc)
27
How do we calculate the error? Error
propagation Analytical (Z x y) (Z
xy)
28
How do we calculate the error? Error
propagation Monte Carlo analysis
Input Data
Result Error
Model
29
How do we calculate the error? Error
propagation Validation error
result Error
result
Input data
Model
validation data
30
Adequacy we require a fundamental shift in
thinking away from qualitative answers and
forward to greater reliance on simple spatial
modelling, combined with qualitative reasoning
Grayson (1993).
31
Analysis of environmental and societal impact
32
Step 3 Integrated analysis
- Using scenarios, explore the
- Abiotic impact (effect of measures)
- Ecological impact (gain loss)
- Socio-economic impact (costs, loss of functions)
- Use common sense! What would happen to the rest
of the world which is not included in the
analysis?
33
Aquatic ecosystems Types and key-variables based
on an existing classification- 29 types (incl.
fish, invertebrates, plants) Key-variables
based on an existing classification-
Intermittence- Flow velocity- Organic pollution
(dissolved organic nitrogen) - Stream dimensions
34
Riparian woodlands Types based on literature- 9
types (e.g. various Alder Swamps, Birch
Wood) Key-variables based on statistical
analysis - Groundwater level - Soil type-
Acidity- Nutrient availability- Flooding
35
Economic costs Based on expert judgment -
Acquisition costs (implementation)- Management
costs (maintaining)- Opportunity
costs (interference)
36
Measure 1 Reducing groundwater extractions(total
of 25 million m3)
37
Measure reducing groundwater extractions
Abiotic change
Groundwater levellt 1 m below elevation
Change of groundwater levels (m) 2.4 0
38
Measure 2 Change infiltration of precipitation in
urban areas - Connectivity of pavement and houses
to sewers is decreased to stimulate
infiltration - Surplus is transferred directly to
the stream instead of a wastewater plant
39
Measure restoration of natural stream conditions
Abiotic change
Groundwater levellt 1 m below elevation
Change of groundwater levels (m)2.4 -0.4
40
Measure 3 Restore natural stream properties -
Re-meandering- Higher elevation of the
riverbed- Removal of weirs
41
Measure 4 Reduce diffuse effluent - Reduction
of effluent from individual households in rural
area - Stopping all effluent in natural area
42
Change of target ecosystem Wet woodlands ( of
riparian area) Groundwater level change
high - low (meters)
1.5
Gain
0
2.5
Rise
0
Drop
Effluent
Groundwater
Urban areas
Natural stream
43
Change of target ecosystem Clean streams ( of
stream) Change of organic pollutionhigh -
low (mg l-1)
10
Gain
0
Loss
20
Better
0
-15
Worse
Effluent
Groundwater
Urban areas
Natural stream
44
Change of target ecosystem Continuous streams
( of stream) Change of intermittencehigh -
low (days a-1)
Gain
3
0
-2
Loss
30
Better
0
-8
Worse
Effluent
Groundwater
Urban areas
Natural stream
45
Change of target ecosystem Running streams (
of stream) Change of flow velocityhigh -
low (m sec-1)
Gain
1
0
-0.5
Loss
Faster
0.05
0
-0.05
Slower
Effluent
Groundwater
Urban areas
Natural stream
46
Economic costs
106 US
1500
Rising costs
1000
500
0
Effluent
Groundwater
Urban areas
Natural stream
47
Restoration of abiotic conditions does not
automatically imply ecological restoration
Change of wet woodlands ( of riparian
area) Groundwater level change high - low
(meters)
48
Measures targeted on restoration of one ecosystem
might cause deterioration of other ecosystems
Measure 3 Restore natural stream properties
49
Cost efficiency
Wet woodlands
Clean streams
More efficient
More efficient
Effluent
Effluent
Groundwater
Urban areas
Groundwater
Urban areas
Natural stream
Natural stream
50
Step 3 Integrated analysis
- Conclusions
- Explore as many possibilities as you can
- Explore both gain loss (dont be afraid for the
negative aspects of a given measure) - A strong abiotic effect does not imply a strong
ecological effect - Dont present one number or index. Give
authorities objective data, on which they can
base their choices.
Recommended
