
Aucun titre de diapositive PowerPoint PPT Presentation
1 / 1
Title: Aucun titre de diapositive
1
Correction of FDG-PET data for Partial Volume
Effect Application to Alzheimer's Disease (AD).
Karim Berkouk1, Mario Quarantelli2, Nacer
Kerrouche1, Béatrice Desgranges1, Anna Prinster2,
Brigitte Landeau1, Bruno Alfano2, Jean-Claude
Baron3 1INSERM (EMI-218), Cyceron, Caen, France
2Biostructure and Bioimaging Institute, National
Council for Research, Naples, Italy3Department
of Neurology, University of Cambridge,
UK Contact berkouk_at_cyceron.fr
Introduction
Decreased FDG uptake in PET is an early marker of
neuro-degenerative changes of AD. However, the
limited spatial resolution of PET scanners
induces partial volume effects (PVE), which, in
turn, decreases PET-FDG concentration. PVE due to
both CSF and WM introduce large errors in FDG
uptake quantification, errors that are amplified
by brain atrophy, a hallmark of AD. Wrongly
denominated atrophy correction, this correction
actually consists of removing PVE due to CSF
and/or WM, PVE that are more prominent when brain
atrophy is present. PVE-correction methods can be
divided into two types the voxel-based
techniques that correct at the voxel level 1-3,
and the ROI-based techniques that correct at the
ROI level 4. Voxel-based methods can either
take into account the effect of surrounding cold
structures such as CSF 2 or more complex GM and
WM concentration levels in an iterative mode 3.
These methods generate PVE-corrected images. On
the other hand, ROI-based methods can also handle
different GM concentrations, but provide
PVE-corrected ROI data only. Among these methods,
only PVE-correction for CSF have been used to
correct large set of AD PET data 5,6. In the
present study, we also correct for PVE due to WM.
Material and Methods
Subjects The control group consists of 13 NV
(mean age of 63.1 9.9 7 females, 6 males). The
AD group is made of 23 patients (mean age 73.3
5.4 13 females, 10 males NINDS-ADRDA
criteria MMSE 22.3 2.5). AD patients were
prospectively selected on the basis of a
neurological examination and a neuropsychological
assessment and were diagnosed as mild AD using
the NINCDS-ADRDA criteria for probable AD. Image
processing FDG-PET (ECAT HR, 2.05x2.05x2.425
mm, image resolution 6.1x6.1x6.7 mm in x,y,z)
and MRI volume data (T1-weighted, 1.5T,
0.9x0.9x1.5 mm) were obtained for each subject.
GM, WM and CSF maps were generated by means of
the probabilistic MRI segmentation using SPM99
7. The probabilistic segmentation data were
transformed into GM, WM and CSF binary maps by
assigning the voxel to the tissue category with
the highest probability. The T1-weighted volume
was co-registered and resliced to the PET data
set using SPM99 8, and the resulting matrix
transformation was also applied to the segmented
images.
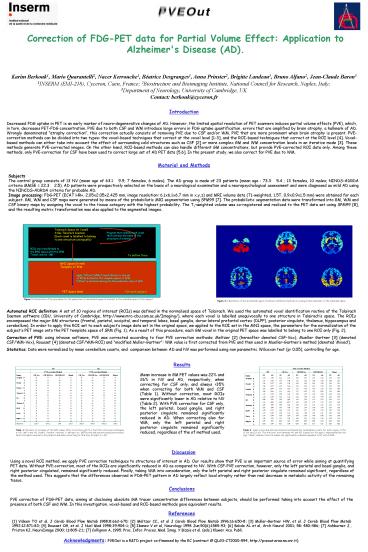
Figure 1 Illustration of the procedure for the
generation of automated region of interest in the
individual space of the subject.
Figure 2 Illustration of the automated region of
interest definition method on a young normal
volunteer, in the individual space.
Automated ROI definition A set of 10 regions of
interest (ROIs) was defined in the normalised
space of Talairach. We used the automated voxel
identification routine of the Talairach Daemon
software (CBU, University of Cambridge,
http//www.mrc-cbu.cam.ac.uk/Imaging/), where
each voxel is labelled unequivocally to one
structure in Talairachs space. The ROIs
encompassed the major GM structures (frontal,
parietal, occipital, and temporal lobes, basal
ganglia, dorso-lateral prefontal cortex (DLPF),
posterior cingulate, thalamus, hippocampus and
cerebellum). In order to apply this ROI set to
each subjects image data set in the original
space, we applied to the ROI set in the MNI
space, the parameters for the normalization of
the subjects PET image onto the PET template
space of SPM (Fig. 1). As a result of this
procedure, each GM voxel in the original PET
space was labelled to belong to one ROI only
(Fig. 2). Correction of PVE using inhouse
software, PVE was corrected according to four PVE
correction methods Meltzer 2 (hereafter
denoted CSF-Vox), Mueller Gartner 3 (denoted
CSF/WM-Vox), Rousset 4 (denoted CSF/WM-ROI) and
modified Muller-Gartner WM value is first
corrected from PVE and then used in
Mueller-Gartners method (denoted Mixed).
Statistics Data were normalized by mean
cerebellum counts, and comparison between AD and
NV was performed using non parametric Wilcoxon
test (plt 0.05), controlling for age.
Results
Mean increase in GM PET values was 22 and 26 in
NV and AD, respectively, when correcting for CSF
only, and always gt35 when correcting for both WM
and CSF (Table 1). Without correction, most ROIs
were significantly lower in AD relative to NV
(Table 2). With PVE correction for CSF only, the
left parietal, basal ganglia, and right posterior
cingulate remained significantly reduced in AD.
When correcting also for WM, only the left
parietal and right posterior cingulate remained
significantly reduced, regardless of the of
method used.
Table 2 Mean corrected and uncorrected
normalised (by cerebellum) counts for each region
of the 13 NV and 23 AD. The Wilcoxon test between
NV and AD (cancel out for age) is represented by
the sign which indicates that AD values are
significantly reduced compared to NV with Plt0.05.
Table 1 Percents of increase of the ROI values
after correction with the four PVE correction
techniques in NV (left) and AD (right). Percent
increase is defined as 100(corrected-uncorrected
)/uncorrected. Note the higher increase in AD
patients and when correcting for WM also. R
Right L Left.
Discussion
Using a novel ROI method, we apply PVE correction
techniques to structures of interest in AD. Our
results show that PVE is an important source of
error while aiming at quantifying PET data.
Without PVE-correction, most of the ROIs are
significantly reduced in AD as compared to NV.
With CSF-PVE correction, however, only the left
parietal and basal ganglia, and right posterior
cingulated, remained significantly reduced.
Finally, taking WM into consideration, only the
left parietal and right posterior cingulate
remained significant, regardless of the method
used. This suggests that the differences observed
in FDG-PET pattern in AD largely reflect local
atrophy rather than real decrease in metabolic
activity of the remaining tissue.
Conclusions PVE correction of FDG-PET data,
aiming at disclosing absolute GM tracer
concentration differences between subjects,
should be performed taking into account the
effect of the presence of both CSF and WM. In
this investigation, voxel-based and ROI-based
methods gave equivalent results.
References 1 Videen TO et al, J Cereb Blood
Flow Metab 19888662-670 2 Meltzer CC., et al
J Cereb Blood Flow Metab 199616650-8 3
Muller-Gartner HW, et al. J Cereb Blood Flow
Metab 199212571-83 4 Rousset OG, et al. J
Nucl Med 199839904-1 5 Ibanez V et al,
Neurology 1998 Jun50(6)1585-93 6 Bokde AL et
al, Arch Neurol 2001 58 480-486 7 Ashburner
J., Friston KJ, NeuroImage 2000 11805-21 7
Collignon A, 1995 Proc. Infor. Proces. Med.
Imag. Y Bizais et al. (eds.) Kluwer Aca. Publi.
Acknowledgments PVEOut is a RTD project
co-financed by the EC (contract
QLG3-CT2000-594, http//pveout.area.na.cnr.it).
Recommended
