
Warm-Up 3.3 PowerPoint PPT Presentation
1 / 11
Title: Warm-Up 3.3
1
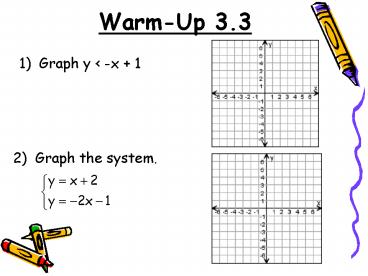
Warm-Up 3.3
1) Graph y lt -x 1
2) Graph the system.
2
3.3 Systems of Linear Inequalities
- What does the graph of a system of inequalities
tell you? - Where is the answer found for a system of
inequalities?
3
Graphing a System of Linear Inequalities
- Graph the line that corresponds to the
inequality. Use a dashed line for an inequality
with lt or gt and a solid line for an inequality
with or . - Lightly shade the half-plane that is the graph of
the inequality. Colored pencils may help you
distinguish the different half-planes. - The graph of the system is the region common
to all of the half-planes.
4
Example 1
Graph the system.
5
Example 1
Graph the system.
6
Example 2
Graph the system.
7
Example 2
Graph the system.
8
Practice
Graph the system.
1)
9
Example 3
Write the system of inequalities graphed below.
x lt 3
y lt 2x 6
10
Warm-Up
Graph the system.
11
- What does the graph of a system of inequalities
tell you? - Where is the answer found for a system of
inequalities?
12
Assignment 3.3
- Page 159, 12-14, 21-26, 28-46 even
Recommended
