
Performance of Growth Models for Salmonella and Other Pathogens - PowerPoint PPT Presentation
1 / 1
Title:
Performance of Growth Models for Salmonella and Other Pathogens
Description:
Performance of Growth Models for Salmonella and Other Pathogens Thomas P. Oscar, Agricultural Research Service, USDA, Room 2111, Center for Food Science and ... – PowerPoint PPT presentation
Number of Views:25
Avg rating:3.0/5.0
Title: Performance of Growth Models for Salmonella and Other Pathogens
1
Performance of Growth Models for Salmonella and
Other Pathogens Thomas P. Oscar, Agricultural
Research Service, USDA, Room 2111, Center for
Food Science and Technology, University of
Maryland Eastern Shore, Princess Anne, MD 21853
410-651-6062 410-651-8498 (fax) toscar_at_umes.edu
INTRODUCTION The prediction bias (Bf) and
accuracy (Af) factors of Ross1 are the most
widely used measures of model performance.
However, Bf does not detect some forms of
prediction bias, Bf and Af are mean values that
are subject to bias by outliers and prediction
cases involving no growth are excluded from
calculation of Bf and Af resulting in an
overestimation of model performance. Thus, the
objective of this study was to develop a method
for evaluating model performance that overcomes
the limitations of Bf and Af. MATERIALS AND
METHODS Published response surface models for
lag time (?) and maximum specific growth rate
(?max) of Salmonella Typhimurium in broth2 or on
sterilized, cooked chicken breast burgers3,4 were
evaluated for the ability to predict the data
used to develop them (verification) and to
predict data not used in model development but
that were inside (interpolation) or outside
(extrapolation) the response surface. Data for
performance evaluation were collected with the
same strain, previous growth conditions and
modeling methods so as not to confound the
comparison of observed and predicted
values. Performance evaluation for interpolation
and extrapolation. Independent data for
performance evaluation of interpolation were
collected with the same strain, growth media and
modeling methods but different combinations of
the independent variables that were within the
response surface of the model. Independent data
for performance evaluation of extrapolation were
collected in the same manner except that the
growth media used to measure growth kinetics was
different and thus, the response surface models
were evaluated for the ability to extrapolate to
a different growth medium. Published data for
other pathogens were also used to develop the
performance evaluation method. Acceptable
prediction zone method. Plots of Bf for
individual prediction cases versus predicted ?
and ?max were evaluated for acceptable prediction
bias and accuracy using an acceptable prediction
zone from a Bf of 0.7 (fail-safe) to a Bf of 1.15
(fail-dangerous). The acceptable prediction zone
was wider in the fail-safe direction because
greater prediction error can be tolerated in this
direction when using models to predict food
safety. The proportion of Bf inside the
acceptable prediction zone (pBf) was calculated
and used as a new measure of model
performance. RESULTS AND DISCUSSION There is
currently no consensus as to what mean values of
Bf and Af constitute a model that provides
acceptable predictions of pathogen growth in
broth or on food. However, for growth rate a
mean Bf in the range of 0.7 to 1.15 has been
proposed as being acceptable5. In the current
study, all mean Bf were in this range except for
extrapolation of broth Model 1 to cooked chicken
thigh burgers, which had a mean Bf of 1.17 (Table
1). In general, mean Af increases by 0.1 to 0.15
per independent variable in the model5. Thus,
models with two independent variables, such as
Models 3 to 6 in the present study, would be
expected to have mean Af of 1.2 to 1.3 and models
with three independent variables, such as Models
1 and 2 in this study, would be expected to have
mean Af of 1.3 to 1.45. All of the models
evaluated in the current study had mean Af that
fell below or in these expected ranges (Table
1). A limitation of mean Bf as a performance
factor is its inability to detect some forms of
prediction bias such as under prediction in one
region of the response surface and over
prediction in another region of the response
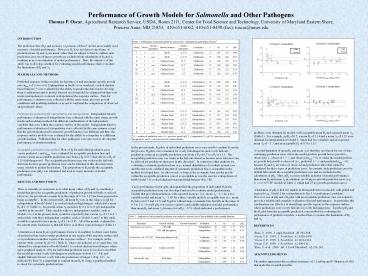
surface5. For example, in the current study, a
mean Bf of 1.01 (Table 1), where one indicates no
average bias, was obtained for extrapolation of
broth Model 1 to cooked chicken breast burgers
when upon graphical analysis of Bf for individual
prediction cases it was discovered that this
model provided overly fail-dangerous predictions
at short ? (lt 4 h) and slightly fail-safe but
not overly fail-safe predictions at longer ?
(Fig. 1A). As indicated by Ross1 it is important
to confirm mean Bf by using a graphical method to
check for systematic prediction bias.
problem, were obtained for models with acceptable
mean Bf and expected mean Af (Table 1). For
example, a pBf of 0.5, a mean Bf of 1.14 and a
mean Af of 1.29 were obtained for interpolation
of Model 5, which had two variables and an
expected mean Af of lt 1.3 and an acceptable Bf of
0.7 to 1.15. A second limitation of mean Bf and
mean Af is that they are biased for sets of data
containing prediction cases where the model
predicts growth but no growth is observed (i.e.,
observed ? ? and observed ?max 0) or where
the model predicts no growth but growth is
observed (i.e., predicted ? ? and predicted
?max 0) because Bf and Af are ratios of
observed and predicted values that cannot be
calculated for these types of prediction cases.
In contrast, such prediction cases by default
fall outside the acceptable prediction zone and
are included in the calculation of pBf. Thus,
pBf is a more reliable indicator of model
performance than mean Bf and mean Af in
situations involving no growth prediction cases
(e.g. E. coli O157H7 models in Table 2, which
had 25 no growth prediction cases). A
limitation of pBf is that it is unable to
distinguish between models with global and
regional (e.g., Model 1 for extrapolation in Fig.
1A) performance problems. However, use of pBf
and a Bf plot with an acceptable prediction zone
was found to provide a reliable and complete
evaluation of model performance. In particular,
this combination was effective at identifying
specific regions in the response surface where
predictions were overly fail-safe or overly
fail-dangerous. Together pBf and the Bf plot
form the acceptable prediction zone method for
evaluating the performance of predictive models,
a method that overcomes the limitations of Bf and
Af. REFERENCES 1Ross, T. 1996. J. Appl.
Bacteriol. 81501-508. 2Oscar, T. P. 1999. J.
Food Prot. 621470-1474. 3Oscar, T. P. 1999.
J. Food Prot. 621111-1114. 4Oscar, T. P. 1999.
J. Food Prot. 62106-111. 5Ross, T. et al.
2000. Int. J. Food Microbiol. 62231-245.
ACKNOWLEDGMENTS The author appreciates the
excellent assistance of J. Ludwig and P. Shannon
of ARS that made this research possible.
In the present study, Bf plots of individual
prediction cases were used to confirm Bf and in
the process, Bf plots were examined for overly
fail-dangerous and overly fail-safe predictions
using an acceptable prediction zone from a Bf of
0.7 to a Bf of 1.15. The acceptable prediction
zone was wider in the fail-safe direction because
more tolerance can be allowed for predictions
that error in this direction5. In contrast to
other methods for evaluating systematic
prediction bias (e.g., normal distribution of
residuals around zero and the runs test), a
defined amount of systematic prediction bias is
acceptable in the method developed here. In
other words, as long as the systematic bias
resides mostly within the acceptable prediction
zone it is acceptable as was the case for
extrapolation of broth Model 2 to cooked chicken
breast and thigh burgers (Fig. 1B). A new
performance factor (pBf) that quantified the
proportion of individual Bf in the acceptable
prediction zone was developed and used to
evaluate model performance. Models that provided
predictions with expected accuracy (i.e., mean Af
lt 1.3 for a two variable model and mean Af lt 1.45
for a three variable model), acceptable bias
(i.e., mean Bf between 0.7 and 1.15) and Bf plots
without large systematic bias had pBf in the
range of 0.7 to 1.0. Overall, pBf was a more
sensitive and reliable indicator of model
performance than mean Bf and mean Af because low
pBf (lt 0.7), which indicated a performance
Recommended
CrystalGraphics Presentations


