
ABSTRACT PowerPoint PPT Presentation
1 / 1
Title: ABSTRACT
1
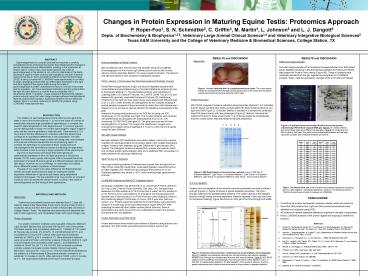
Changes in Protein Expression in Maturing Equine
Testis Proteomics Approach P. Roper-Foo1, S.
N. Schmidtke2, C. Griffin3, M. Martin4, L.
Johnson5 and L. J. Dangott6 Depts. of
Biochemistry Biophysics1,2,6, Veterinary Large
Animal Clinical Science3,4 and Veterinary
Integrative Biological Sciences5Texas AM
University and the College of Veterinary Medicine
Biomedical Sciences, College Station, TX
RESULTS and DISCUSSION
RESULTS and DISCUSSION
- ABSTRACT
- Spermatogenesis is a complex process that
requires a carefully orchestrated series of
biochemical events that initiate specific changes
in cellular development and differentiation
resulting in the production of mature sperm.
Unlike many mammalian species, the onset of
spermatogenesis in the stallion is not uniformly
distributed in the testis resulting in regions of
light (actively spermatogenic) and dark
(inactive) parenchymal tissue. Semi-quantitative
Difference Gel Electrophoresis (DIGE) is being
coupled with LC/MS/MS mass spectrometry in an
effort to begin cataloging proteins that are
differentially expressed in the light and dark
regions of the equine testis during the onset of
spermatogenesis to better understand the factors
involved in the onset and its regulation. We
have developed methods to extract proteins from
the light and dark tissue in a manner that is
compatible with 2-dimensional DIGE. In addition,
image analysis of fluorescently labeled protein
extracts using DeCyder Image Analysis software
has delimited at least 40 proteins that change in
expression between the two testicular regions.
Work is currently underway to identify the
proteins using LC/MS/MS mass spectrometry.
Specimens
DIGE and Image Analysis DeCyder Image Analysis
of the fluorescent images detected over 900
protein spots. Statistical analysis in the BVA
Module selected 40 Proteins of Interest that
passed the Protein Filter criteria (Figure 4B).
These 40 proteins were robotically excised from
the gel, digested and prepared for LC/MS/MS
analysis. Table 1 lists the expression changes of
the 40 Proteins of Interest.
Immuno-depletion of Blood Proteins IgG and
albumin were removed from the samples using
immunoaffinity chromatography. An Anti-Human IgG
affinity column and an anti-Human Albumin column
(GenWay Biotech, CA) were coupled in tandem. The
albumin and IgG-free fractions were pooled for
subsequent analysis. DIGE Labeling,
2-Dimensional Gel Electrophoresis and Multiplex
Imaging Pooled flow through fractions of IgG and
albumin depleted samples were concentrated and
precipitated using a Chloroform/Methanol protocol
(6) prior to fluorescent labeling (7). The
precipitated proteins were solubilized in
Labeling buffer (7M Urea/2M Thiourea, 4 CHAPS,
30mM Tris, pH 8.5) and labeled with spectrally
resolvable fluorescent CyDyes (GE Healthcare).
Proteins from the light and dark parenchyma were
labeled with different dyes (Cy3 or Cy5) in order
that they be distinguished by the multiplex
imaging. A pooled sample composed of equal
amounts of protein from both tissues was labeled
(Cy2) to provide an internal standard for
statistical comparisons of the gels. Isoelectric
focusing was performed on an IPGPhor focusing
unit (GE Healthcare) on IPG DryStrips overnight.
The focused proteins were reduced with
dithiothreitol and alkylated with iodoacetamide
and run on 12 acrylamide 2D SDS PAGE slab gels
(8). The gels were scanned at three wavelengths
on a Typhoon Trio Imager (GE Healthcare). Images
were analyzed and cropped using ImageQuant 5.1
prior to multi-channel analysis using DeCyder
Software. DeCyder Image Analysis DeCyder
software (GE Healthcare) was used to detect,
match and compare migration of individual
proteins for all protein spots in the multiple
fluorescent images. Proteins were detected using
the Differential In-gel Analysis (DIA) module.
The Biological Variation Analysis (BVA) module
was used to match and compare protein spots
between gels, and a statistical filter was
applied to detect proteins with gel-to-gel
differences. Spot Picking and Digestion Gel
plugs containing proteins of interest were
excised from the gels with an Ettan Picker robot
(GE Healthcare). Automated digestion was
performed on an Ettan Digester (GE Healthcare)
according to Shevchenko et. al. (9). Extracted
peptides were stored in -80oC while awaiting mass
spectrometric analysis. LC/MS/MS Analysis and
MASCOT Database Search Nanospray LC/MS/MS was
performed on an LCQ DecaXP Thermo Electron Ion
Trap LCMS (Thermo-Fisher Scientific, San Jose,
CA). Samples were dissolved in a 98 solution A
(0.1 Formic Acid in water) and 2 solution B
(0.1 Formic Acid in acetonitrile) for 30 minutes
at room temperature and injected onto a
hand-packed, 6 cm PicoFrit column (New Objective,
Woburn, MA) containing Magic C18AQ resin (5
micron, 200 ? pore size, Michrom, Auburn, CA).
Protein sequences obtained from electrospray were
searched using an in-house copy of the automated
search engine MASCOT after extracting the data
with the Distiller module (Matrix Science).
Search parameters were set to account for any
modifications made to the proteins during
extraction and digestion. Protein Estimation and
SDS PAGE Protein estimations were made by the
method of Bradford using albumin as a standard
(10). SDS PAGE was performed according to Laemmli
(8).
B
A
Figure 1. A cross sectional view of a
prepubescent horse testis. This cross section
reveals the contrast between the light colored
parenchyma in the center and the darker colored
parenchyma around the perimeter of the organ.
Protein Extraction SDS PAGE analysis of proteins
extracted using Extraction Methods 1 2
indicated that the tissue samples were highly
contaminated with blood proteins (albumin and
IgG) and DNA (Figure 2). Extraction Method 2
resulted in a sample that contained less DNA
(less viscous) with less proteolysis (Figure 2).
Method 2 became the method of choice for these
experiments. The continued presence of
substantial albumin contamination required
additional sample preparation.
INTRODUCTION The initiation of spermatogenesis
occurs uniformly throughout the testis in many
mammalian species (1, 2) and is the result of a
series of events that produces large quantities
of spermatozoa. In contrast, the onset of
spermatogenesis in colts begins around 1.5 years
of age and can be distinguished visually the
central spermatogenic region is light in color
and the inactive periphery is relatively dark.
Clemmons et al. (3) have shown that the
differences in coloration within the parenchyma
correspond to quantitative differences in cell
populations. The dark region is characterized by
large numbers of Leydig cells, macrophages and
small seminiferous tubules that are not producing
sperm. In contrast, the light tissue is composed
of fewer Leydig cells and macrophages as the
seminiferous tubules (containing non-pigmented
cells) increase in size to occupy a larger
proportion of the parenchyma. Ing et al (4) have
shown previously that select genes are
preferentially expressed in dark and light
parenchyma. Microarray studies of 9132 human
genes with equine cDNAs revealed that at the
expression of at least 88 equine genes are
different between light and dark tissue. However,
to our knowledge, no information is available
about differential protein expression in these
tissues. The goal of our project is to utilize
Difference Gel Electrophoresis (DIGE) and mass
spectrometry to begin to catalog the protein
expression differences in light and dark tissue
using established proteomic techniques. The
pre-pubertal horse may provide an excellent model
by which to identify the protein factors involved
in the onset of spermatogenesis and the timing of
their appearance.
1 2 3 4 5
Figure 4. A multiplex fluorescent image (Panel A)
and a total protein stained image (Panel B) of a
typical DIGE gel. Panel A An overlay of three
fluorescent dyes scanned at different
wavelengths. Panel B An image from the BVA
module in DeCyder. The yellow circles indicate
pick proteins and the flags represent a protein
spots respective Master gel number.
Figure 2. SDS Page Analysis of two extraction
methods. Lane 1 MW Std, 2 Extraction Method 1,
Light Tissue, 3 Extraction Method 1, Dark
Tissue, 4 Extraction Method 2, Light Tissue, 5
Extraction Method 2, Dark Tissue. Arrow points
to albumin.
Immuno-depletion Tandem immuno-depletion of the
extracts removed substantial amounts of albumin
and IgG (Figure 3). Figure 3A shows a typical
depletion procedure. The Flow-through material is
the depleted testis proteins. The waste material
is the stripped albumin and IgG being removed
separately. Material depleted in this way was
used for fluorescent labeling. Figure 3B shows an
SDS gel of the flow-through and waste.
Table 1. The Protein Pick List. A list of
proteins that change expression comparing Dark to
Light (negative decreased expression positive
increased expression). The first six spots were
chosen for analysis on LC/MS/MS.
MATERIALS AND METHODS Specimens Testes from
pre-pubertal horses were obtained from 1-2 year
old stallions raised at the Texas State Prison
Farm (Wynne Prison Farm) in Huntsville, Texas and
from the Horse Center at Texas AM University in
College Station, Texas. The testicles were
sectioned and dissected into light or dark
regions (3), and immediately frozen with liquid
nitrogen (N2). Protein Extraction Two protein
extraction methods were evaluated. Extraction
Method I Light and dark tissues were pulverized
with liquid N2 into a fine powder. The tissue
powder was immediately dissolved in 1 milliliter
of 7 M Urea/2 M Thiourea (de-ionized), 4 CHAPS,
18 mM dithiothreitol (DTT), and incubated for 0.5
hours at 4o Celsius. After spinning the extracted
materials at 13000 x g for 5 minutes (4o C), the
supernatant materials were removed and frozen
until further analysis. Extraction Method 2
Light and dark tissues were pulverized under
liquid N2, and dissolved in 1 milliliter of 10mM
Tris, pH 7.5, 4 CHAPS, that contained a protease
inhibitor cocktail (Complete Cocktail Tablets,
Roche Diagnostics, Mannheim, Germany) for 1 hour
on ice. This was followed immediately by the
addition of a Ribonuclease A/Deoxyribonuclease I
cocktail for an additional 15 minutes on ice (5).
After spinning at 13000 x g for 5 minutes at 4o
C, the supernatant materials were frozen until
further analysis.
- CONCLUSIONS
- Conditions have been developed to prepare a
stallion testicular proteome. - More than 900 proteins from Light and Dark
parenchymal tissues were detected and analyzed
using DIGE. - 40 proteins of interest displayed statistically
significant changes in expression. - Nano LC/MS/MS analysis of the protein digests are
ongoing to identify the proteins.
- References
- Courot, M., Hochereau-de Reviers, M-.T. and
Ortavant, R. Spermatogenesis. IN Johnson AD,
Gomes,Van Demark NL,(eds.) The Testis. vol. I.
New York Academic Press 1970339-442. - Johnson, L. Spermatogenesis. In Cupps P.T.
(ed.), Reproduction in Domestic Animals, 4th ed.
New York Academic Press 1991 173-219. - Clemmons, A.J., Thompson, D.L., Jr. and Johnson,
L. (1995) Biol Reprod61258-1267. - Ing, N.H., Laughlin, A.M., Varne,r D.D., Welsh,
T.H., Jr., Forres,t D.W,, Blanchard, T.L, and
Johnson, L. (2004) J Androl. 25535-544. - Wessel, D., and Fugge, U.I. Analytical
Biochemistry (1984), 138 141-143 - O'Farrell, P.H. (1975) J Biol Chem. 250,
4007-4021. - Unlu, M., Morgan, M.E. and Minden, J.S. (1997)
Electrophoresis 18 2071-2077. - Laemmli, U.K. (1970). Nature. 227, 680-685.
- Shevchenko, A., Tomas, H., Havlis, J., Olsen,
J.V. and Mann, M. (2006) Nature Protocols 1
2856-2860. - Bradford, M. M. (1976) Anal. Biochem. 72248-254.
Figure 3. Reduction of blood protein contaminants
by Immunoaffinity chromatography. Panel A
Depletion chromatogram showing flow- through
fractions with albumin-depleted sample
(Flow-Through) and contaminants removed from
sample (Waste). Panel B SDS PAGE analysis of
Immunoaffinity chromatography Flow-through
fractions after depletion. Lane 1 MW Std, 2
sample before depletion, 3 after depletion.
Arrow points to albumin. Note the greatly reduced
amount of albumin and enrichment of other
proteins in depleted fractions.
Recommended
