
Estimating Second and Thirdyear Nitrogen Availability from Dairy Manure PowerPoint PPT Presentation
1 / 1
Title: Estimating Second and Thirdyear Nitrogen Availability from Dairy Manure
1
Estimating Second- and Third-year Nitrogen
Availability from Dairy Manure
P.R. Cusick, K.A. Kelling, P.E. Speth,
Department of Soil Science, University of
Wisconsin-Madison J.M. Powell, USDA-ARS, Dairy
Forage Research Center, Madison,WI.
- Summary
- For all methods estimated second year residual N
availabilities are based on 3 site-years of data
and estimated third year residual N
availabilities are based on 2 site-years of data. - The difference and fertilizer equivalence
methods results were highly variable for one-time
manure applications. Across both methods results
average 50 g N kg-1 and ranged from 280 to 250 g
N kg-1 of applied manurial N for estimated
second-year residual N availability. Results for
estimated third-year N availability averaged 27 g
N kg-1 and ranged 380 to 240 g N kg-1 of applied
manurial N. - 15N estimates based on one time manure
applications greatly reduced variability and
created consistently positive results and were in
good agreement with other 15N studies. Second-
and third-year residual manure N availability
estimates based on one time manure applications
using 15N were 55 and 23 g N kg-1 of applied
manurial N, respectively. Results varied from 40
to 74 g N kg-1 of applied manurial N for
second-year estimates and 20 to 26 g N kg-1 of
applied manurial N for third-year estimates. - The 15N method is the best method used in the
study as it directly measures residual N uptake.
However, due to pool substitution or
mineralization-immobilization and turnover of N
with the soil organic matter, labeled N is
diluted with unlabeled N that is then uptaken by
the plant and these estimates may be low.
Although, the estimates may be inherently low but
represent what might be minimum uptake (Hauck and
Bremner, 1976 Jenkinson et al., 1985). - Using multiple manure applications to determine
apparent N availability using the fertilizer
equivalence and difference methods is difficult
because multiple manure applications frequently
out yielded high fertilizer applications. - The 15N method more consistently reveals
residual effects using multiple manure
applications with less variability. Compared
with a single manure application, there is a 140
g N kg-1 of applied N increase over 4 years of
consecutive applications. - It is evident that much variability exists with
the difference and fertilizer equivalence
methods. The 15N method has displayed the best
reliability. There is confidence that additional
data using the 15N will solidify estimates for
residual N availability. Currently, the
University of Wisconsin estimates residual N from
dairy manure to be 10 and 5 for the second and
third year respectively (Kelling et al., 1998). - A decay series based on a single manure
application using the 15N method is estimated to
be 0.14 (data not shown)(Muñoz, 2001), 0.05, and
0.02. - References
- Hauck, R.D., and J.M. Bremner. 1976. Use of
Tracers for Soil and Fertilizer Nitrogen
Research. Advances in Agronomy 28219-261. - Jenkinson, D.S., R.H. Fox, and J.H. Rayner. 1985.
Interactions between fertilizer nitrogen and soil
nitrogen- the so-called 'priming' effect. J. of
Soil Sci. 36425-444. - Kelling, K.A., L.G. Bundy, J.C. Converse, and
J.B. Peters. 1998. Soil test recommendations to
field, vegetable and fruit crops. University of
Wisconsin Extension. Pub. A2809. - Klausner, S.D., V.R. Kanneganti, and B. D.R.
1994. An Approach for Estimating a Decay Series
for Organic Nitrogen in Animal Manure. Agron. J.
86897-903. - Motavalli, P.P., K.A. Kelling, and J.C. Converse.
1989. First-Year Nutrient Availability from
Injected Dairy Manure. J. Environ. Qual.
18180-185. - Muñoz, G.R. 2001. Estimate of manure availability
using 15N-labeled manure and other techniques.,
University of Wisconsin, Madison.
Abstract It is common practice to repeatedly
apply dairy manure to the same fields. To
accurately assess the total plant availability of
manure nutrients, it is necessary to account for
the nutrients remaining in soil from previous
years applications. A corn (Zea mays) field
experiment has continued since 1998 on a Plano
silt loam. Residual manure N availability was
estimated for two and three years after a single
manure application from differences in
whole-plant N uptake using 1) fertilizer N
equivalence 2) the difference method and 3) 15N
labeled manure. Second year availability using
the fertilizer equivalence and difference method
was estimated to be 73 and 26 g N kg-1 manure N
applied, respectively. The respective third year
availabilities were estimated to be 76 and 130 g
N kg-1 manure N applied. Estimates of 15N
recovery were 53 and 23 g N kg-1 manure N applied
for second and third year, respectively.
Fertilizer equivalent and difference methods
showed great variability with estimated
availabilities ranging from 40 to 240 and 380
to 250 g N kg-1 manure N applied, respectively.
This variability was much reduced using the 15N
method with recovery of residual 15N, ranging
from 20 to70 g N kg-1 manure N applied. However
this approach also requires a 15N fertilizer
comparison to estimate relative use efficiency
and accurately establish an N credit.
Introduction An increased knowledge of the
value of manure is needed to increase its value
as a fertilizer and to avoid excess nutrient loss
to the environment. Since manure is commonly
applied to the same fields year after year it is
important to understand the cumulative effects of
these multiple year applications. Not only do
producers and advisors need to understand
first-year nutrient availability and losses, they
also need to recognize and account for residual
effects. The objective of this work is to
estimate residual nitrogen availability from
single and multiple manure applications and to
determine reliable methodologies to make these
estimates. Materials and Methods Site
Characteristics West Madison Agricultural
Research Station, Madison, WI (43 05N 89
31W) Plano silt loam (fine-silty, mixed, mesic,
Typic Argiudolls) Established 1998, has
continued to present Corn (Zea mays L. c v Lemke
6063) Treatments Fertilizer------------------ 45
,90,135,180, and 224 kg N ha-1, applied every
year as NH4NO3 preplant, broadcast. Manure-------
------------ 35 and 71 Mg ha-1 (wet basis), 222
and 450 kg N ha-1, applied every 1,2,or 3
years. 15N Microplots--------- 35 Mg ha-1 (wet
basis), 222 kg N ha-1, applied every 1,2,or 3
years. Average N rate Study Design Split
plots in randomized complete block design with
four replicates. Measurements Whole plant at
physiological maturity and grain yields. N
concentration of whole plants. 15N concentration
of whole plant nitrogen from microplots. Nitrogen
Availability Difference Method (Motavalli et
al., 1989) Apparent N recovery Treatment N
Uptake Control N Uptake 100
Amount of Total Applied Relative
Effectiveness Apparent N recovery (manure
treatment) 100
Apparent N recovery
(fertilizer treatment) Fertilizer
Equivalence (Motavalli et al., 1989) Nutrient
Availability Estimated equivalent fertilizer N
rate 100
Total N from manure applied 15N Method (Hauck
and Bremner 1976) 15N recovered P(c
b)100 P amount N in corn silage (manure-amended
plots) (a b) amount of manure
N applied a atom 15N in the manure
b natural abundance of 15N in corn silage
(control plots) c atom 15N in corn silage
(manure-amended plots).
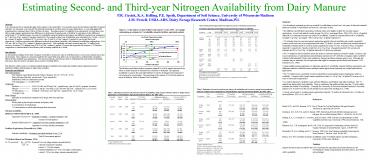
Figure 1. Grain yield at various fertilizer and
manure N rates, 2000. An example determining an
estimate for N availability using the fertilizer
equivalent method.
The fertilizer equivalence method compares
manurial N yield or uptake responses from where a
similar response is obtained from a fertilizer N
treatment. The apparent availability is equal to
the equivalent fertilizer N rate by dividing the
total manurial N rate expressed as a percentage.
The percentage is the amount of N from the manure
in terms of fertilizer, which is deemed 100
available.
Recommended
