
Tropical Cyclones, pt. 2 PowerPoint PPT Presentation
Title: Tropical Cyclones, pt. 2
1
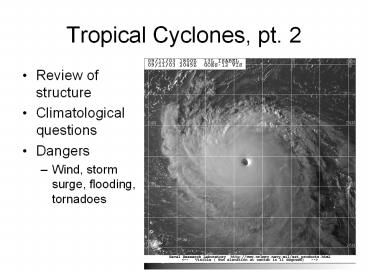
Tropical Cyclones, pt. 2
- Review of structure
- Climatological questions
- Dangers
- Wind, storm surge, flooding, tornadoes
2
Why are TCs named?
Tropical cyclones are named to provide ease of
communication between forecasters and the general
public regarding forecasts, watches, and
warnings. Since the storms can often last a week
or longer and that more than one can be occurring
in the same basin at the same time, names can
reduce the confusion about what storm is being
described. For more info, visit
http//www.aoml.noaa.gov/hrd/tcfaq/B1.html
3
Radial profile of TC winds Wind speed of
Hurricane Anita (1977). Note the exponential
increase from the eye, out to a radius of
maximum winds of 30 km, then exponential
decrease toward the periphery of the tropical
cyclone.
Source Holland (1981)
4
Hurricane Fran Category 3
5
Mitch (1998) Statistics
- 9000 deaths in Nicaragua Honduras
- Minimal central pressure 905mb
- Max sustained winds 155kt (180mph)
- 2nd strongest October hurricane ever recorded
- 7th strongest hurricane ever in Atlantic
6
Hurricane Wilma Category 5
7
Hurricane GilbertCompare to Wilma Mitch
(location)
8
Cyclone Monica23 April 2006
Most intense TC in 2006. But, just how intense?
9
Cyclone Monica23 April 2006
Most intense TC in 2006. But, just how
intense? Australia (Darwin) 905 hPa, sustained
surface winds 135 kts (10-min) Joint Typhoon
Warning Center (Hawaii) 879 hPa 145 knots
(1-min) Dvorak (Wisconsin) satellite estimate
869 hPa 170 kts (1-min)
10
How intense is this western Pacific typhoon?
11
How intense is this western Pacific typhoon?
NOAA CI number 7.0 (140kts, 898mb) JMA 925mb
95 kts (10-min speed 108 kts 1-min speed)
12
Different landfall intensities JTWC 110kt G 140
kt 1-min sustained Cat 4 JMA 75 kt 10-min
mean 84 kt 1-min sustained CAT 2 CWB 74 kt G
93 kt 10-min mean 83 kt G 104 kt CAT 2 HKO
90 kt 10-min mean 101 kt CAT 3 Only one can
be correct. But which is it? And will we ever
know?
13
Most intense Atlantic hurricanesIntensity is
measured solely by central pressure
Rank Hurricane Season Min. pressure
1 Wilma 2005 882 mb (hPa)
2 Gilbert 1988 888 mb (hPa)
3 "Labor Day" 1935 892 mb (hPa)
4 Rita 2005 895 mb (hPa)
5 Allen 1980 899 mb (hPa)
6 Katrina 2005 902 mb (hPa)
7 Camille 1969 905 mb (hPa)
7 Mitch 1998 905 mb (hPa)
9 Ivan 2004 910 mb (hPa)
10 Janet 1955 914 mb (hPa)
14
Most intense global TCs
Rank Name Pressure Location Year
1 Typhoon Tip 870 mb Western Pacific 1979
2 Typhoon Gay 872 mb Western Pacific 1992
2 Typhoon Ivan 872 mb Western Pacific 1997
2 Typhoon Joan 872 mb Western Pacific 1997
2 Typhoon Keith 872 mb Western Pacific 1997
2 Typhoon Zeb 872 mb Western Pacific 1998
7 Typhoon June 875 mb Western Pacific 1975
8 Typhoon Forrest 876 mb Western Pacific 1983
9 Typhoon Ida 877 mb Western Pacific 1958
9 Typhoon Nora 877 mb Western Pacific 1973
11 Typhoon Rita 878 mb Western Pacific 1978
11 Typhoon Yvette 878 mb Western Pacific 1992
11 Typhoon Damrey 878 mb Western Pacific 2000
14 Typhoon Vanessa 879 mb Western Pacific 1984
14 Typhoon Angela 879 mb Western Pacific 1995
14 Typhoon Faxai 879 mb Western Pacific 2001
14 Cyclone Zoe 879 mb South Pacific 2002
14 Typhoon Chaba 879 mb Western Pacific 2004
19 Typhoon Violet 882 mb Western Pacific 1961
19 Hurricane Wilma 882 mb Atlantic 2005
21 Typhoon Irma 884 mb Western Pacific 1971
22 Typhoon Mike 885 mb Western Pacific 1990
22 Cyclone Daryl-Agnielle 885 mb South Indian 1995
24 Hurricane Gilbert 888 mb Atlantic 1988
25 Labor Day Hurricane 892 mb Atlantic 1935
15
How is TC intensity determined?
- Ground-based observations (ships, ocean buoys,
surface stations, and Doppler radar) - Aircraft reconnaissance (only for the Atlantic
basin though West-Pacific from - Satellite estimates
- - most common method of estimation (b/c most TCs
do not reach land or pass over buoys). - - Based on historical relationships between wind
and minimum pressure
16
Dvorak technique flow chart
17
Dvorak technique flow chart, continued
T-Number Winds (knots) Minimum Pressure (millibars) Minimum Pressure (millibars)
T-Number Winds (knots) Atlantic NW Pacific
1.0 - 1.5 25 ---- ----
2 30 1009 1000
2.5 35 1005 997
3 45 1000 991
3.5 55 994 984
4 65 987 976
4.5 77 979 966
5 90 970 954
5.5 102 960 941
6 115 948 927
6.5 127 935 914
7 140 921 898
7.5 155 906 879
8 170 890 858
Note The pressures shown for the NW Pacific are lower as the pressure of that whole environment is lower as well. Note The pressures shown for the NW Pacific are lower as the pressure of that whole environment is lower as well. Note The pressures shown for the NW Pacific are lower as the pressure of that whole environment is lower as well. Note The pressures shown for the NW Pacific are lower as the pressure of that whole environment is lower as well.
Take the current intensity (T-number) from the
Dvorak technique and translate that into wind and
pressure estimates
18
Tropical cyclone climatology
Many current studies examining the links between
global climate change and changing Atlantic and
global TC activity
19
Numbers of weak (category 1, 2) hurricanes have
remained generally steady over the last 35 yrs,
but numbers of category 4 5 hurricanes have
dramatically increased. Is this due to global
warming, better observing technology, or a
combination of factors? Simple answer is that we
just dont know for sure.
20
Global datasets are not perfect!
One example southern hemisphere was very poorly
observed (no land, few ships) before 1977. In
1977, GMS-1 satellite launched, resulting in
great increase in number of TCs detected
annually. Still important to include the
Southern Hemisphere in the global datasets
because the SH does account for between 25 and
35 of global TC activity!
21
Total number of TCs has remained relatively
constant over past 35 years. Longevity of TCs
has exhibited some variability in this same
period, peaking in early 1990s and decreasing to
present. Source Webster, P. J., G. Holland, J.
Curry, and H.-R. Chang, 2005 Changes in Tropical
Cyclone Number, Duration, and Intensity in a
Warming Environment. Science, 309, 1844-1846.
22
Total numbers of hurricanes has exhibited strong
year-to-year variability (especially West Pacific
WPAC and Southern Hemisphere SH). However,
biggest interest is in the marked increase in
very strong hurricanes (Categories 4 5) in the
past 15 years. Source Webster, P. J., G.
Holland, J. Curry, and H.-R. Chang, 2005 Changes
in Tropical Cyclone Number, Duration, and
Intensity in a Warming Environment. Science,
309, 1844-1846.
23
Similar to the Webster et al. study on the
previous slide, Emanuel confirmed the increasing
destructiveness (measured by a Power Dissipation
Index, PDI, which is very sensitive to higher
wind speeds) of Atlantic and West Pacific
hurricanes in the last 15 years.
Source Emanuel, K. A, 2005 Increasing
destructiveness of tropical cyclones over the
past 30 years. Nature, 436, 686-688.
24
Some conclusions from global warming tropical
cyclones 1- global sea surface temperatures have
warmed in the last 35 yrs 2- numbers of named
storms has remained relatively constant in last
35 yrs ( 80 storms per yr) 3- numbers of intense
storms (cat 3-4-5) has increased in the last 35
yrs 4- computer simulations of high carbon
dioxide (the main global warming culprit) seem to
indicate not more hurricanes, but instead
stronger hurricanes (see figure at right) 5-
large degree of uncertainty is associated with
all of these findings (from SST values, to
numbers of storms in the past 35 yrs, to numbers
of storms expected in next 80 yrs)
Results from a global climate model simulation
a shift of the mean toward more intense, and a
shift of the variance toward more frequent
intense events
25
Hurricane Dangers
- Straight-line winds
- Winds that circulate around the low
- Storm surge
- Sea water pushed onshore by strong winds
- Tornadoes
- Frictional drag enhances vertical shear
- Generally weak (F0 to maybe F2)
- Inland rain
- The deadliest hurricane killer in the last 30
yrs - Katrinas deaths heavily skewed the statistics
26
(No Transcript)
27
Straight Line Winds
- Strongest
- winds on
- right side
- With respect
- to storm motion
28
- Hurricane Katrina
- 90 kt wind
- 965mb pressure
- Departing FL into GoM
29
- Hurricane Katrina
- 100 kt wind
- 941mb pressure
- Category 3 intensity
- Notice the storm is asymmetric
30
- Hurricane Katrina
- 150 kt wind
- 902 mb pressure
- 6th lowest ever in Atlantic
- Notice the incredible symmetry of the inner-most
winds - At this point most of the surge is being
generated (water is being piled up north
northeast on the right side of Katrina)
31
- Hurricane Katrina
- 110 kt wind
- 920 mb pressure
- Interaction with Louisiana Mississippi
- Note surface winds are disrupted over land
- Note Katrinas winds are quite asymmetric
- Notice direction of winds are pushing gulf waters
towards Lake Pontchartrain - New Orleans barely has hurricane-force winds
32
- Hurricane Ivan at landfall (Alabama / Florida
border) - 110kt wind
- 943mb pressure
- Note eye just east of Mobile Bay
- Note asymmetry in wind field
33
(No Transcript)
34
(No Transcript)
35
(No Transcript)
36
(No Transcript)
37
(No Transcript)
38
(No Transcript)
39
(No Transcript)
40
(No Transcript)
41
(No Transcript)
42
Example from hurricane Edouard (1996) showing the
cooling effects of a hurricane Strong hurricane
winds act to mix the warm surface water with
cooler water from below Shows the need to not
only have warm sea surface temperatures, but also
to have a sufficiently deep layer of warm water
to minimize this mixing (gt50 meters)
43
Storm Surge
- Increase in ocean level
- direct wind-driven water
- uplift enhanced by atmospheric pressure drop
- sea level will rise 1 centimeter for every 1
millibar decrease in atmospheric pressure - so a 900 mb hurricane will have 1 meter of surge
associated with pressure drop - Coastline shape has an effect
- Concave enhances
- Bays, inlets (Appalachia Bay, FL)
- Convex diminishes
- Headlands
- Evacuations are primarily to avoid storm surge
- Katrinas 1,830 deaths attributed mostly to
storm surge flooding (drownings resulting from
breaking of dikes levees)
44
Storm Surge
45
Storm Surge Simulation
- High terrain
- Steep slope
- Less surge danger
- Low terrain
- Gentle slope
- More surge danger
46
(No Transcript)
47
Each county develops evacuations based on
expected storm surge conditions Obviously
stronger storms will have more surge that goes
farther inland thus more people need to be
evacuated
48
- States and counties have locally identified
evacuation routes for their coastal citizens - Problems occur when
- Hurricane strengthens rapidly before landfall
more people need to evacuate (and others get
scared want to evacuate) - Hurricane approaches parallel to coastline need
to evacuate larger areas due to uncertainty - Infrastructure doesnt support quick or efficient
evacuations (i.e., Houston during Rita in 2005)
49
(No Transcript)
50
Katrinas 27-foot storm surge
Waveland, Mississippi
51
Inland Flooding
- Tropical cyclones are prolific rain producers
- Typical hurricane drops 6 to 10 along its track
- If storm is slow, or moves over mountainous
terrain rainfall is enhanced - TS Allison, 2001
- 30 in Houston, 6 billion in damage
- Hurr. Mitch, 1998
- 10,000 killed in Honduras / Nicaragua
- Jeanne, 2004
- 1,500 killed in Haiti
- Floyd, 1999
52
Hurricane Floyd
53
(No Transcript)
54
Hurricane Floyd at Landfall
55
Inland Flooding Hurricane Floyd
56
Inland Flooding Hurricane Floyd
57
Hurricane Floyd vs. May 3 Tornadoes
- 56 people died in the US due to Floyd
- 48 (or 86) due to drowning in inland freshwater
flooding - Vehicle deaths 31 people (25 men)
Hurricane Floyd in NC vs. May 3rd Tornadoes in OK
3 billion in damage 1.2 billion in damage
7,000 homes destroyed 2,314 homes destroyed
56,000 homes damaged 7,428 homes damaged
56 deaths 36 deaths
58
Tornadoes
- Occur in land-falling tropical cyclones
- Typically in spiral bands and right-front
quadrant - Very difficult to predict need
- Vertical shear
- Remember vertical shear is detrimental to a
tropical cyclone! - Higher-than-normal instability
59
Examples from 2005Katrina
60
Examples from 2005Rita
61
Examples from 2005Rita
62
Examples from 2004Charley
63
Examples from 2004Charley
64
Examples from 2004Frances
65
Examples from 2004Frances
66
Examples from 2004Frances
67
Examples from 2004Frances
68
Examples from 2004Ivan
69
Examples from 2004Ivan
70
Examples from 2004Ivan
71
Tropical cyclone fundamentals
- TC originates over tropical oceans and is driven
principally by heat transfer from the ocean - Almost always develop over open ocean water whose
temp gt 26C - Behave as an approximately axisymmetric vortex
- Wind max 10-100km from center, then decaying as
r -1/2 - Max upward vertical velocity 5-10 ms-1
- In eye, sinking air 5-10cms-1
- Boundary Layer Equations
Source Smith 2003
72
Basic energetics
- Recognized early on (Riehl 1950 and Kleinschmidt
1951) that TC energy source is heat transfer from
ocean - Charney and Eliassen (1964) caused 15-yr hiccup
by proposing an alternate energy source CISK - Current research has reverted to earlier theories
(and expanded them), e.g., Emanuels (1986)
air-sea interaction - Flux of momentum (into the sea)
- Flux of enthalpy (from the sea)
73
Resulting wind equation
- Surface wind is function of
- Ratio between transfer coefficients (to be
revisited shortly) - Thermodynamic efficiency
- Enthalpy disequilibrium from ocean to air
- This disequilibrium forms the core of air-sea
interaction theory!
74
Interesting side note . . .
- Dissipative heating
- Sink of energy from the boundary layer
- If vertically integrate this equation to obtain
the kinetic energy dissipation - Average TC dissipates 3 x 10¹² W
- Equal to rate of power consumption in the US in
the year 2000!
75
Positive feedback mechanism
- Increased wind ? greater enthalpy flux Fk ?
increased winds ? greater flux, etc etc - Limit on intensity when dissipation (which
grows as cube of velocity) reaches equilibrium
with enthalpy flux
76
Surface drag coefficient CD
- CD is a function of
- Z0, U10
- wave age
- ratio of local friction velocity to phase speed
of dominant spectral component - wave steepness
- As CD decreases, Vmax increases
- Commonly-used linear formulation based on Large
and Pond (1982)
77
Sea state in very high wind speeds
Source Emanuel 2003 Courtesy NWS Chicago
78
- Role of sea spray in the hurricane boundary layer
- Not understood
- Never been studied (until very recently)
Source Powell 2003
79
GPS dropwindsondes (1998-pres)vertical wind
profiles
- Resembles log wind profile in lowest 100-200 m
- Decreases w/height above 300 m
Source Franklin et al. 2003
80
Vertical wind profile (as a percentage of the
700mb flight-level wind)
- Notes
- Wind max occurs between 300 and 600 m and
decreases above that - Coincident with thermal wind balance of a
warm-core cyclone (Bluestein vol. 1, p. 187-88) - Mitch, the strongest cyclone of the group, had
lowest wind max - Agrees with theory of reduced roughness length in
high wind environments
Source Franklin et al. 2003
Recommended
