
Periodic Table PowerPoint PPT Presentation
Title: Periodic Table
1
Periodic Table Trends
2
History of the Periodic Table
- 1871 Mendeleev arranged the elements according
to 1. Increasing atomic mass 2. Elements w/
similar properties were put in the same row - 1913 Moseley arranged the elements according
to 1. Increasing atomic number 2. Elements
w/ similar properties were put in the same column
3
Group Names
Alkali 1 Alkaline Earth Metals 2 3 -3 -2 Halogen -1 Noble Gases 0
H 1 He 2
Li 3 Be 4 B 5 C 6 N 7 O 8 F 9 Ne 10
Na 11 Mg 12 Al 13 Si 14 P 15 S 16 Cl 17 Ar 18
4
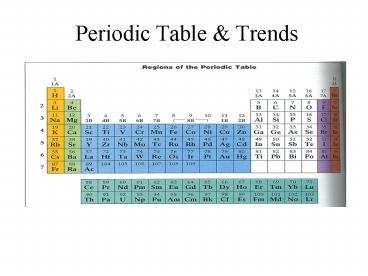
METALS
NONMETALS
TRANSITION METALS
- S P block Representative Elements
- Metalloids (Semimetals, Semiconductors) B,Si,
Ge, As, Sb, Te (properties of both metals
nonmetals) - Columns groups or families Rows -
periods
5
Periodic Groups
- Elements in the same column have similar chemical
and physical properties - These similarities are observed because elements
in a column have similar e- configurations (same
amount of electrons in outermost shell)
6
Periodic Trends
- Periodic Trends patterns (dont always hold
true) can be seen with our current arrangement of
the elements (Moseley) - Trends well be looking at
- Atomic Radius
- Ionization Energy
- 3. Electronegativity
7
Atomic Radius
- Atomic Radius size of an atom
- (distance from nucleus to outermost e-)
8
Atomic Radius Trend
- Group Trend As you go down a column, atomic
radius increases - As you go down, e- are filled into orbitals that
are farther away from the nucleus (attraction not
as strong) - Periodic Trend As you go across a period (L to
R), atomic radius decreases - As you go L to R, e- are put into the same
orbital, but more p and e- total (more
attraction smaller size)
9
Ionic Radius
- Ionic Radius
- size of an atom when it is an ion
10
Ionic Radius Trend
- Metals lose e-, which means more p than e-
(more attraction) SO - Cation Radius lt Neutral Atomic Radius
- Nonmetals gain e-, which means more e- than p
(not as much attraction) SO - Anion Radius gt Neutral Atomic Radius
11
Ionic Radius Trend
- Group Trend As you go down a column, ionic
radius increases - Periodic Trend As you go across a period (L to
R), cation radius decreases, - anion radius decreases, too.
- As you go L to R, cations have more attraction
(smaller size because more p than e-). The
anions have a larger size than the cations, but
also decrease L to R because of less attraction
(more e- than p)
12
Ionic Radius
13
Ionic Radius
- How do I remember this?????
- The more electrons that are lost, the greater the
reduction in size. - Li1 Be2
- protons 3 protons 4
- electrons 2 electrons 2
- Which ion is smaller?
14
Ionic Radius
- How do I remember this???
- The more electrons that are gained, the greater
the increase in size. - P-3 S-2
- protons 15 protons 16
- electrons 18 electrons 18
- Which ion is smaller?
15
Ionization Energy
- Ionization Energy energy needed to remove
outermost e-
16
Ionization Energy
- Group Trend As you go down a column, ionization
energy decreases - As you go down, atomic size is increasing (less
attraction), so easier to remove an e- - Periodic Trend As you go across a period (L to
R), ionization energy increases - As you go L to R, atomic size is decreasing (more
attraction), so more difficult to remove an e- - (also, metals want to lose e-, but nonmetals
do not)
17
Electronegativity
- Electronegativity- tendency of an atom to attract
e-
18
Electronegativity Trend
- Group Trend As you go down a column,
electronegativity decreases - As you go down, atomic size is increasing, so
less attraction to its own e- and other atoms
e- - Periodic Trend As you go across a period (L to
R), electronegativity increases - As you go L to R, atomic size is decreasing, so
there is more attraction to its own e- and other
atoms e-
19
Reactivity
- Reactivity tendency of an atom to react
- Metals lose e- when they react, so metals
reactivity is based on lowest Ionization Energy
(bottom/left corner) Low I.E High Reactivity - Nonmetals gain e- when they react, so
nonmetals reactivity is based on high
electronegativity (upper/right corner) - High electronegativity High reactivity
20
Metallic Character
- Properties of a Metal 1. Easy to shape
- Conduct electricity 3. Shiny
- Group Trend As you go down a column, metallic
character increases - Periodic Trend As you go across a period (L to
R), metallic character decreases (L to R, you are
going from metals to non-metals
Recommended
