
The Scientific Method - PowerPoint PPT Presentation
1 / 19
Title:
The Scientific Method
Description:
Use the Scientific Method to test hypothesis. ... Qualitative data. ... Organize data in tables and charts. Create graphs. – PowerPoint PPT presentation
Number of Views:95
Avg rating:3.0/5.0
Title: The Scientific Method
1
The Scientific Method
2
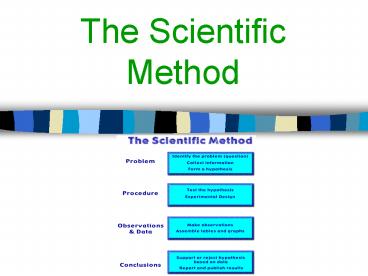
What is the Scientific Method?
- A set of steps or procedures that you follow
when conducting an experiment.
3
OBSERVATION Asking a Question
- Use the 5 senses to record what you observe.
Then turn your observations into a question.
4
HYPOTHESIS
- A proposed scientific explanation. This
statement is testable and can be confirmed with
experimentation or further observation.
5
PREDICTION
- Forecast what will happen in an experiment if the
hypothesis is true - Written in an if-then statement
6
Which box represents observations?
B In 1976 an outbreak in South Africa started
with individuals suffering from severe headaches,
fevers, bloody diarrhea, and vomiting.
Eventually they suffered from internal bleeding
with blood leaking from the nose, ears, and skin.
Finally death came from collapse of the
cardiovascular system due to lack of blood.
- A
- What causes the victims to die?
- How is it transmitted?
- What might differ between these investigations?
D The virus is isolated from a victim causes the
hemorrhagic fever.
C If the virus were the causing agent, then
introduction of the virus into healthy tissue
would cause cell death.
7
Which box represents observations?
Observation (B) In 1976 an outbreak in South
Africa started with individuals suffering from
severe headaches, fevers, bloody diarrhea, and
vomiting. Eventually they suffered from internal
bleeding with blood leaking from the nose, ears,
and skin. Finally death came from collapse of
the cardiovascular system due to lack of blood.
8
Which box represents questions?
- A
- What causes the victims to die?
- How is it transmitted?
- What might differ between these investigations?
D The virus is isolated from a victim causes the
hemorrhagic fever.
C If the virus were the causing agent, then
introduction of the virus into healthy tissue
would cause cell death.
9
Which box represents observations?
Observation (B) In 1976 an outbreak in South
Africa started with individuals suffering from
severe headaches, fevers, bloody diarrhea, and
vomiting. Eventually they suffered from internal
bleeding with blood leaking from the nose, ears,
and skin. Finally death came from collapse of
the cardiovascular system due to lack of blood.
- Questions (A)
- What causes the victims to die?
- How is it transmitted?
- What might differ between these investigations?
10
Which box represents a Hypothesis?
D The virus is isolated from a victim causing the
hemorrhagic fever.
C If the virus were the causing agent, then
introduction of the virus into healthy tissue
would cause cell death.
11
Which box represents observations?
Observation (B) In 1976 an outbreak in South
Africa started with individuals suffering from
severe headaches, fevers, bloody diarrhea, and
vomiting. Eventually they suffered from internal
bleeding with blood leaking from the nose, ears,
and skin. Finally death came from collapse of
the cardiovascular system due to lack of blood.
- Questions (A)
- What causes the victims to die?
- How is it transmitted?
- What might differ between these investigations?
Prediction (C) If the virus were the causing
agent, then introduction of the virus into
healthy tissue would cause cell death.
Hypothesis (D) The virus is isolated from a
victim causes the hemorrhagic fever.
12
MINI LABCAN SCIENTIFIC METHODS BE USED TO SOLVE
A PROBLEM?
13
EXPERIMENT
- Test the hypothesis and prediction
14
EXPERIMENT
- A. Controlled experiment has a control group
and an experimental group differing by only one
factor (variable). - Constants Variables that remain the same between
the experimental and control groups. - Ex. When testing the effects of fertilizer on
fruit production, everything would stay the same
between two groups of plants (water, sunlight
exposure, amount of fertilizer etc). They only
difference is the type of fertilizer. - ? This way any difference seen between the two
plants would have to be due to the fertilizer.
15
EXPERIMENT
- B. Independent vs Dependent Variable
- Independent (cause) variable scientists change
or manipulate - Dependent (effect) changes as independent
changes. The variable you are measuring. - Ex Scientists control fertilizer type given to
plant (independent variable), but have no control
over how many fruits the plant produces
(dependent).
16
EXPERIMENT
- C. Collecting data (information scientist gather)
- Observations and measuring
- Sampling (using a small part to represent a
bigger part) must be large and random - Quantitative (numerical and objective) vs
qualitative (observed or descriptive and
subjective) data.
Ex. Fruit color would be qualitative data whereas
the number of fruits produced would be
quantitative data.
17
DATA ANALYSIS
- Organize data (tables, graphs, etc.)
- Run statistics and model data
- Accept or reject hypothesis
18
Draw or form CONCLUSION
- Explain data, results, hypothesis
- Make inferences
- Summarize experiment and form new questions
19
COMMUNICATE
- Share your findings with other scientists.
- Talk Internet Write
Recommended
CrystalGraphics Presentations


