
Testing the flux tower upscaling hypothesis at a regional scale - PowerPoint PPT Presentation
1 / 8
Title:
Testing the flux tower upscaling hypothesis at a regional scale
Description:
Testing the flux tower upscaling hypothesis at a regional scale – PowerPoint PPT presentation
Number of Views:35
Avg rating:3.0/5.0
Title: Testing the flux tower upscaling hypothesis at a regional scale
1
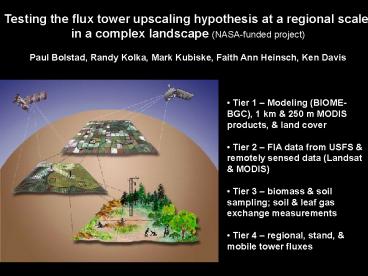
Testing the flux tower upscaling hypothesis at a
regional scale in a complex landscape
(NASA-funded project) Paul Bolstad, Randy Kolka,
Mark Kubiske, Faith Ann Heinsch, Ken Davis
- Tier 1 Modeling (BIOME-BGC), 1 km 250 m
MODIS products, land cover - Tier 2 FIA data from USFS remotely sensed
data (Landsat MODIS) - Tier 3 biomass soil sampling soil leaf
gas exchange measurements - Tier 4 regional, stand, mobile tower fluxes
2
Measurement of fluxes with towers equipped
with eddy covariance instrumentations at two
spatial scales
2) Stand level 30 m Results Forest stand as CO2
sink
1) Regional level Very tall tower at WLEF 400
m Results Region as CO2 source/weak sink
Why are these results conflicting?
3
Mobile eddy covariance and stationary
micrometeorological measurements in clearcuts and
wetlands An update
Nick Saliendra Mark Kubiske Ron Teclaw Dan
Baumann USDA Forest Service North Central
Research Station Ecophysiological Processes
Unit Forestry Sciences Lab Rhinelander, WI
4
- Two Mobile EC Systems
- 3-D sonic anemometer (CSAT3)
- Open path IRGA (LI-7500)
- CR5000 data logger
- Measurements at 10 Hz
- Half-hourly averaging
- Five Micrometorological
- Stations
- PAR (photosynthetically active
- radiation)
- Temperature
- Relative humidity
- Precipitation
- Soil H2O temperature (clearcuts)
- Depth of water table (wetlands)
- Half-hourly averaging
5
Mobile EC sites for Tier 4
6
Riley Creek (Ameba Salvage)
Thunder Creek
Clearcut Sites
7
Wetland Sites
Riley Creek (Ameba Salvage)
Wilson Flowage
South Fork
Forested Wetland (east of WLEF)
8
Schedule of mobile flux tower measurements - year 1 (2005) of the NASA project Schedule of mobile flux tower measurements - year 1 (2005) of the NASA project Schedule of mobile flux tower measurements - year 1 (2005) of the NASA project Schedule of mobile flux tower measurements - year 1 (2005) of the NASA project Schedule of mobile flux tower measurements - year 1 (2005) of the NASA project Schedule of mobile flux tower measurements - year 1 (2005) of the NASA project Schedule of mobile flux tower measurements - year 1 (2005) of the NASA project Schedule of mobile flux tower measurements - year 1 (2005) of the NASA project Schedule of mobile flux tower measurements - year 1 (2005) of the NASA project
Date DoY 8-Day Clearcut Sites Clearcut Sites Clearcut Sites Wetland Sites Wetland Sites Wetland Sites
Date DoY Period Riley Cr. Thunder Cr. Chen1 S. Fork Wilson Fl. Chen2
May 25 - Jun 1 145 1 EC2
Jun 2 - 9 153 2 EC2 EC1
Jun 10 - 17 161 3 EC1 EC2
Jun 18 - Jul 25 169 4 EC2 EC1
Jun 26 - Jul 3 177 5 EC1 EC2
Jul 4 - 11 185 6 EC2 EC1
Jul 12 - 19 193 7 EC1 EC2
Jul 20 - 27 201 8 EC1 EC2
Jul 28 - Aug 4 209 9 EC2 EC1
Aug 5 - 12 217 10 EC1 EC2
Aug 13 - 20 225 11 EC2 EC1
Aug 21 - 28 233 12 EC1 EC2
Aug 29 - Sep 5 241 13 EC2 EC1
Sep 6 - 13 249 14 EC1 EC2
Sep 14 - 21 257 15 EC2 EC1
Sep 22 - 29 265 16 EC1 EC2
Date of measurements coincide with the 8-day MODIS compositing periods. Date of measurements coincide with the 8-day MODIS compositing periods. Date of measurements coincide with the 8-day MODIS compositing periods. Date of measurements coincide with the 8-day MODIS compositing periods. Date of measurements coincide with the 8-day MODIS compositing periods. Date of measurements coincide with the 8-day MODIS compositing periods. Date of measurements coincide with the 8-day MODIS compositing periods.
Recommended
CrystalGraphics Presentations


