
Three factors determine canopy reflectance PowerPoint PPT Presentation
1 / 33
Title: Three factors determine canopy reflectance
1
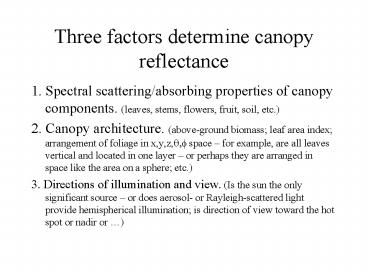
Three factors determine canopy reflectance
- 1. Spectral scattering/absorbing properties of
canopy components. (leaves, stems, flowers,
fruit, soil, etc.) - 2. Canopy architecture. (above-ground biomass
leaf area index arrangement of foliage in
x,y,z,q,f space for example, are all leaves
vertical and located in one layer or perhaps
they are arranged in space like the area on a
sphere etc.) - 3. Directions of illumination and view. (Is the
sun the only significant source or does
aerosol- or Rayleigh-scattered light provide
hemispherical illumination is direction of view
toward the hot spot or nadir or )
2
Three factors determine canopy reflectance
- 2. Canopy architecture. (above-ground biomass
leaf area index arrangement of foliage in
x,y,z,q,f space for example, are all leaves
vertical and located in one layer or perhaps
they are arranged in space like the area on a
sphere etc.) - Well look at problem of using RS data to
estimate canopy architectural parameters LAI,
chlorophyll concentrations, fpar and Apar
3
Examples How to remotely sense chlorophyll, LAI
fpar
- How to estimate LAI
4
First, notice that canopy reflectance varies with
Leaf Area
Examples How to remotely sense chlorophyll, LAI
fpar
Question How to calculate canopy LAI?
0.5
very high leaf area
0.4
very low leaf area
0.3
sunlit soil
reflectance
0.2
0.1
0.0
400
600
800
1000
1200
Wavelength, nm
On moderately bright soil - In visible canopy
reflectance decreases as leaf area per unit
ground area (LAI) increases - In NIR canopy
reflectance increases as LAI increases
5
Examples How to remotely sense chlorophyll, LAI,
fpar
i.e. Note how Red and NIR reflectance varies with
leaf area density
Red spectral region, dense canopy
Reflectance
NIR spectral region, dense canopy
Red spectral region, sparse canopy
NIR spectral region, sparse canopy
Reflectance
6
Estimation of Leaf Area Index (LAI) and Fraction
of Photosynthetically Active Radiation
Intercepted (FPAR)
Bottom line
- Models have been developed that estimate these
two variables from spectral measurements. - LAI f(spectral variables) FPAR g(spectral
variables) - Initial efforts during the 1980s were simple and
involved vegetation indices. - Recent models are complex the MODIS Algorithm
Theoretical Basis Document (ATBD) for FPAR runs
more than 100 pages.
7
Examples How to remotely sense chlorophyll, LAI
fpar
- Conclusion
- LAI can be estimated as a function of red and NIR
canopy reflectances. The relationship varies
with species, canopy architecture (for example
30 inch vs 1 meter soybean row widths) and other
factors.
8
Examples How to remotely sense chlorophyll, LAI
fpar
- What about Phytomass
9
What about estimating Phytomass?
Examples How to remotely sense chlorophyll, LAI
fpar
First lets define phytomass leaf area x leaf
mass per unit area (m2 x kg/m2 kg) Then lets
introduce some surrogates for phytomass Leaf
Area Index (LAI) one sided leaf area per unit
ground area (square meters of leaf area per
square meter of ground area Leaf area density
(LAD) leaf area per unit volume
Why use area instead of mass? Because estimating
the leaf mass per unit area using remote sensing
is very difficult. (How thick and heavy are the
leaves?) Estimating area is more straight forward.
10
Examples How to remotely sense chlorophyll, LAI
fpar
- How to estimate Chlorophyll
11
Chlorophyll Concentrations
Examples How to remotely sense chlorophyll, LAI
fpar
Red or blue wavelength radiance, reflectance
chlorophyll concentration
12
Most canopies absorb almost all light in
chlorophyll absorption bands. This means that a
large change in canopy chlorophyll content would
result in little change in the canopy reflectance
measured in the chlorophyll bands.Better
strategy measure instead on the side of the
absorption well - on the red edge.
Examples How to remotely sense chlorophyll, LAI
fpar
13
Correlation coefficient between canopy
reflectance and canopy leaf area is negative in
visible and positive in NIR.
Examples How to remotely sense chlorophyll, LAI
fpar
Notice
Therefore, it must be zero between visible NIR
0.5
1.0
very high leaf area
0.4
Correlation positive
very low leaf area
reflectance()
0.3
Correlation Coefficient
sunlit soil
0.0
0.2
Correlation negative
Correlation 0.0 at approximately l 0.71mm
0.1
0.0
-1.0
400
600
800
1000
1200
400
600
800
1000
1200
wavelength
wavelength
Its possible to estimate both leaf chlorophyll
content canopy chlorophyll content from canopy
measurements. Heres how. Since there is zero
correlation between canopy reflectance and LAI _at_
0.71 mm, canopy reflectance measurements at
0.71mm estimate average leaf chlorophyll content.
Then obtain canopy chlorophyll content by
multiplying average leaf chlorophyll content x
LAI.
Neat Result
14
Examples How to remotely sense chlorophyll, LAI
fpar
- Conclusion
- We can estimate chlorophyll content of both
leaves and plant canopies from RS measurements.
15
Examples How to remotely sense chlorophyll, LAI
fpar
- How to estimate Fpar and Apar
16
Lets model decrease of sunlight in a canopy in
the visible (PAR) using a single scattering
model
Examples How to remotely sense chlorophyll, LAI
fpar
- 1. Assume spherical leaf angle distribution.
- (Leaf area distributed like area on a
sphere) - 2. Decrease of solar irradiance with depth z into
canopy follows Beers absorption law - where LAD is leaf area density (the leaf area
per - cubic meter of the canopy), I is the
irradiance at - the top of the canopy and c1 is a fudge
factor. - 3. The irradiance at zsoil can be used to
estimate Apar - 4. The irradiance at zsoil divided by the
above-canopy irradiance can be used to estimate
fpar - 5. Finally, Apar and fpar are proportional to the
canopy radiance and canopy reflectance,
respectively.
17
Examples How to remotely sense chlorophyll, LAI
fpar
- So now we can estimate assimilation of carbon by
a canopy using RS data to provide the input data
for the Monteith equation.
18
Chlorophyll and Carbon Assimilation
Examples How to remotely sense chlorophyll, LAI
fpar
Monteith Equation The sum at each point in time
of the product of Apar, the photosynthetically
active radiation absorbed by the canopy,
multiplied by the conversion efficiency of
photons to assimilated carbon
Actual carbon assimilated by canopy each day
Satellite remote sensing can provide estimates
for one time during the day of Aparand/or Fpar,
the fraction of the PAR intercepted by the canopy.
19
Examples How to remotely sense chlorophyll, LAI
fpar
- Note the difference between actual assimilation
(given by Monteith equation) and potential
assimilation provided by canopy chlorophyll
content!!!
20
Chlorophyll and Carbon Assimilation
Examples How to remotely sense chlorophyll, LAI
fpar
Potential carbon assimilation by canopy
Amount of chlorophyll in canopy
Concentration (?g chlorophyll/kg of plant) x
chlorophyll (kg) density (?g chlorophyll/m2 of
leaf) x LAI x area of canopy
21
Example How to remotely sense chlorophyll, LAI
fpar
- Overall Conclusion
- We are able to use RS data to estimate many
canopy architectural parameters including LAI,
chlorophyll content of leaves and canopy, fpar,
Apar and other variables we have not considered
here.
22
Lets Revisit Vegetation Indices
- The gigantic chlorophyll absorption well
distinguishes vegetation from non-vegetation. - Its size tells us chlorophyll concentration in
the leaf and the canopy. - Many vegetation indices are a simplistic attempt
to estimate the size of this absorption well.
23
Estimating the size of the absorption well
What are Vegetation Indices?
24
Vegetation Indices
- Vegetation indices (VI) are combinations of
spectral measurements in different wavelengths as
recorded by a radiometric sensor. They aid in the
analysis of multispectral image information by
shrinking multidimensional data into a single
value. Huete (1994) defined vegetation indices
as - dimensonless, radiometric measures usually
involving a ratio and/or linear combination of
the red and near-infrared (NIR) portions of the
spectrum. VI s may be computed from digital
counts, at satellite radiances, apparent
reflectances, land-leaving radiances, or surface
reflectances and require no additional ancillary
information other than the measurements
themselvesWhat VI s specifically measure remains
unclear. They serve as indicators of relative
growth and/or vigor of green vegetation, and are
diagnostic of various biophysical vegetation
parameters.
25
Vegetation Indices
- Vegetation indices (VIs) can be broken up into
two basic categories - Ratio based indices VIs based on the ratio of
two or more radiance, reflectance, or DN values
(or linear combinations thereof). - Difference indices VIs based on the
difference between the spectral response of
vegetation and the soil background.
26
Common Ratio Indices
Simple Ratio Index (SR) NIR/R
Normalized Difference Vegetation Index (NDVI)
27
(No Transcript)
28
Typical Vegetation Index Response
But what about other objects within the field of
view (FOV) of the sensor other than vegetation?
29
Leaf area Density
30
Composite Canopy Reflectance
100 veg. Cover 1 leaf layer LAI 1
0 veg. Cover LAI 0
1 m2 of leaf area
pixel
50 veg. Cover 2 leaf layers LAI 1
33 veg. cover 3 leaf layers LAI 1
Are the reflectances of these 3 pixels the same?
31
Composite Canopy Reflectance
This region of the curve is dominated by a change
in percent vegetation cover
100 vegetation cover
In this region, there is complete vegetation
cover and differences are due to increasing
canopy density-Additive Reflectance (multiple
scattering)
32
Recent VIs to remember...
- There are a Gazillion VIs in the literature...
- Ive proposed one...ignore it - and most others
in the literature. - Right now, the important VIs to know are
- SAVI, Soil Adjusted VI
- ARVI, Atmospherically Resistant VI
- SARVI, Soil Atmospherically Resistant VI
- EVI, Enhanced VI
33
Theory behind ...
- Would like LAI ltgtVI
- Curves of constant LAI on tasseled cap
- Curves of constant LAI are species dependent
- Many small leaves vs. few big leaves same LAI
but more vs. less multiply scattered light and
therefore higher vs lower reflectance and
therefore larger vs. smaller VI for same LAI - Species dependent VI might overcome this effect...
Recommended
