
21CMAPAST data analysis PowerPoint PPT Presentation
1 / 21
Title: 21CMAPAST data analysis
1
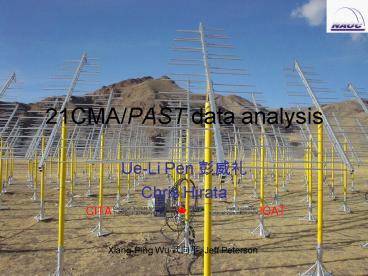
21CMA/PAST data analysis
- Ue-Li Pen ???
- Chris Hirata
Xiang-Ping Wu ???, Jeff Peterson
2
Reionization
- First objects
- 21cm _at_ z6
- 50-200 Mhz
- ?T 23 mK, 0.3 mJy
- Angular scale 5
z10 simulation, Furlanetto et al, 2004
3
Foreground Synchrotron
408 MHz Haslam
Much brighter than signal, but no spectral
structure
4
Detectability
- Luminosity proportional to object volume bigger
structures easier to find - Noise dominated by galaxy T300(f/150 Mhz)-2.5,
higher frequency (lower redshift) much easier - Mean emission very hard to discern (Gnedin and
Shaver 2004). - First targets Stromgren spheres around bright
quasars (Wyithe and Loeb 2004).
5
21CMA/PAST Site
6
21CMA/PAST Strategy
- Fast track to data avoid custom design,
off-the-shelf only. - Use existing TV technology, commodity PCs for
correlations - Learn as you build fast turnaround, flexibility
7
Antenna Design
- Noise dominated by galaxy
Tgal280 (150Mhz/f)2.5 K _at_ NCP - sensitivity 104 m2 effective area
- Resolution aperture synthesis,80 elements, 3km
baselines - Receiver noise NF
- Pointing at north celestial pole, elevation 43o
- simple,fast?Currently 23 hexagonal pods, 12
correlating
8
Ulastai
Urumqi 150 km
42º 55N 86º 45 E elev 2600m
Ustir station
Ground shield5000m mountains on all sides
9
(No Transcript)
10
(No Transcript)
11
Software correlator
12
U-V map data
Almost no interference, excellent u-v coverage
13
Protype data, Feb, 2005
12 working pods of 127 antenna each
NCP
3C061.1
100-200 Mhz, 10o FOV
14
CMB Analogy
- Searching for very low surface brightness sources
- Potentially severe foregrounds
- Fully sampled u-v planes different from CLEANing
- Statistics of noise and foregrounds can be
described very accurately - Large Field of view planar assumption breaks.
WMAP 120 deg difference map
15
CMB map making
- Linear algebra approach to map making
- Used by most experiments, including WMAP, Planck,
Boomerang, DASI, CBI - Exactly solvable for Gaussian random fields
- Noise properties fully characterized
- Computationally expensive
- Fast workarounds CG, multigrid, etc.
16
Data Flow
- raw time stream
- Optimal map construction to reduce data size
Deconvolution, Wiener, etc - Foreground removal
- Noise covariance matrix
- Power spectrum
- Window functions
17
Analysis procedure
- Calibrate system from celestial sources
- Determine beam from sky
- Generalized BEAM contains all processes between
source and data ISM, ionosphere, antenna,
polarization, transmission line, etc. - Wiener filtered map
18
(No Transcript)
19
Same for polarization consider all polarization
to be noise, solve for I map. One needs to know
the beam accurately! Varies with time,
frequency, position on sky, position of antenna,
ionosphere, instrument. Calibration from bright
point sources (Hirata)
20
Computational Complexity
- O(N3) not tractable for all sky, workable for
small fields at low resolution, up to 105 pixels - Accelerated plans in development Conjugate
gradient, multigrid (e.g. Pen 2004) as used in
lensing and CMB analysis
21
Conclusions
- Linear map making theory well understood from CMB
analysis, optimal algorithms for Gaussian fields,
even full sky. - Minimum signal-to-noise deconvolved foreground
subtraction with Wiener filters, implementation
on real data in progress
Recommended
