
An Ideal Plume PowerPoint PPT Presentation
1 / 23
Title: An Ideal Plume
1
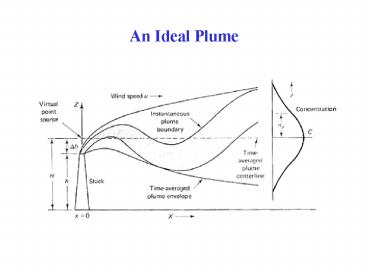
An Ideal Plume
2
Derivation of Gaussian Dispersion Model
Q rate of chemical release (mass/time)
Using the conservation of mass principle
For a source on ground
For an elevated source such as a stack
3
Gaussian (Normal) Distribution
4
Derivation of Gaussian Dispersion Model _ Contd.
Define
And Modify the dispersion equation we derived to
match the Gaussian model for a ground source
y0 and z0 are the coordinates where the highest
concentration occurs
5
Gaussian Dispersion Model from a stack
H
hs
- y0 the value of y where the C(x,y,z) is the
maximum - In this case it is the centerline (or y 0)
- z0 the value of y where the C(x,y,z) is the
maximum - In this case it is the height of the centerline
plume - H effective stack height hs ?h
- z0 H
Without Reflection
6
Point Source above Ground Level at Height H
Z-H
Z
hs
-hs
-Z
7
For the unreflected plume
For the plume with reflection (general solution)
8
Dispersion Equation Different Forms
General Equation Plume with Reflection for
Stack Height H
Ground Level Concentration Stack at Height H
?z0
Ground Level Center Line Concentration Stack at
Height H
Ground Level Center Line Ground Point Source
9
Example
NOx emission from a stack at a rate of 100 g/s
from an urban stack of physical height 100m and a
plume rise of 50m. What is the ground-level
concentration at a distance of 500 m from the
stack and along the center-line on a clear sunny
day? Wind speed is measured at 2 m/s at 10m.
Equation for emission from a stack with Reflection
z 0
y 0
Centerline ?
Ground Level ?
H hs ?h
hs 100 ?h 50 ? H 150
10
Example contd.
Stability Class Calculation
u 2 m/s at 10m
From Table 3-1, Clear ?Strong insolation?Stability
class A or B
us ?
From Table, 3-3 For Urban area and Stability
Class A p 0.15
us 3 m/s
11
Example -contd.
Dispersion Coefficients Calculation
Two options to compute ?y and ? z -
1. Graphical (from Fig 4.6 and 4.7)
For x 500 m
? y 120 m
? z 120 m
12
Example -contd.
2. Empirical Equations (from Equations 4.12-14
and Tables 4.1 and 4.2)
?y From Table 4.1, c 27.167 d 2.553
? y465.11628.(x).tan(0.01745(c d (lnx)))
x in km 0.5 km
? y465.11628.(x).tan((0.45/?).180) 113.01 m
? z From Table 4.2, a 346.75 b 1.7283
? Z a xb 346.75 . (0.5)1.7283 104.65 m
? z 105 m
u 3 m/s
Data
Q 100 g/s
H 150 m
? y 113 m
483 ?g/m3 of NOX
13
Example 2
NOX emission from a stack
Estimate NOX concentration at ground level, 100m
crosswind, 500 m from the stack
326 ?g/m3 of NOX
NAAQS standard for NO2 100 ?g/m3 for annual
average
14
Calculation of Effective Stack Height
H hs ?h, where ?h is the stack rise. Stack
rise is dependant on stack characteristics, Meteor
ology, and physico-chemical nature of effluent.
Carson-Moses Equation
kJ/s
m gas mass flow rate, kg/s
Holland Formula
Ts stack gas temperature, K
Ta ambient temperature, K
Vs stack gas exit velocity, m/s
us wind speed at exit, m/s
d stack exit diameter, m
Concawe Formula
All Equations assuming that no stack tip downwash
occurs i.e. when Vs 1.5 us
15
Preferred Equation for Stack Rise
16
Topography
BLUFF
2B-y
P
B
y
Y axis
x
17
Line Sources
Series of Industries along a river
Heavy traffic on a highway
y
U
x
?y is considered negligible crosswind
compensation
Uniform concentration along y-axis
-y
18
Line Sources
y
?
U
x
-y
For wind at an angle ? gt 45o, and continuous line
source
19
Finite Line Sources
y2
U
x
Edge Effects must be considered
y1
20
Instantaneous Source Short Term Puff at height,
H
U
x1
x2
(0,0,0H
t2 x2/U
t1 x1/U
Note QT is total mass released (?g). ?x ? ?y.
Note that ? values are in Table 4.7 of Wark,
Warner and Davis (Third Edition)
21
Structure of a Dispersion Model
Emissions Source co-ordinates Physical
height Stack gas velocity Stack gas
temperature Emission rate
Meteorology Wind direction Wind speed Stability
class Temperature Mixing height
Receptors Co-ordinates Height
Simulation of Atmospheric chemistry and physics
Estimates of air pollutant concentrations at
receptors
22
Concentration Isopleths
Concentration / ?g.m-3
0
0
Downwind distance / meters
Concentration isopleths
23
Estimating Emission Rate Q for Various Scenarios
(Ref A Kumar, Pollution Engineering, p 52,
February (1996)
Accidental Release of Low volatile liquid from a
tank on ground
Accidental Release of Highly Volatile Liquid from
Tank on Ground
Accidental Release of Heavier-than-air gas from a
tank on ground
Recommended
