Simple Linear Regression -1 - PowerPoint PPT Presentation
1 / 84
Title:
Simple Linear Regression -1
Description:
Title: Simple Linear Regression Keywords: simple linear regression, correlation, mcclave, benson, sincich Last modified by: GUEST – PowerPoint PPT presentation
Number of Views:146
Avg rating:3.0/5.0
Title: Simple Linear Regression -1
1
????????????-1
- Simple Linear Regression -1
2
????
- 1. ???????????
- 2. ???????????
- 3. ???????????
- 4. ????(y)??????
- 5. ??????????
3
?????
- 1. ??????(??)???????
- 2. ??????????????????????????
- 3. ?????????????????
- 4. ????
- ??????(deterministic models)
- ????(probabilistic models)
4
????Deterministic Models
- 1. ??????????????
- 2. ?????????
- 3. ?? NT30.7(??)US ?y rx
A touch down is a touch!!
1??2.54?? 1??0.45359?? 65 mpg 104.61 km/hr
5
????Probabilistic Models
- 1. ?????????????????????(??30?????????)
- 2. ???????????????????????
- ?????30???????
- ????????????????
- 2. ?? ??? ?10 ???? ????
- Y 10X e
- ??????,????????,?????????????(????????????)
6
????????
????
????
????
????
7
??????????
Positive Linear Relationship
Relationship NOT Linear
Negative Linear Relationship
No Relationship
8
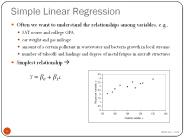
?????? Simple Regression Models
- 1. ?????????????
- 2. ??????????
- f(x) y b m x ?
- y????????(response variable???)
- ??????????(dependent)
- x????????(independent variables)
- 3. ?????????????????
9
???????? Simple Regression Models
- 1. ????????
- ?????????(??)???
- ???????????
- ??????????????
- ????????????
- ????????????
10
??????????
??? ???.XLS
11
??????????1
12
??????????2
13
????????????
F
- 1. ?????????????????
- 2. ???????
- 3. ??????????????
- ??????????
- 4. ????
- 5. ????????????
14
????????
- 1. ?????????????
- ????(???????????????????)
- ????(???????????????)
- 2. ????????????????
- ????? (???????,????)
- ???? (??linear????non-linear)
15
???????
- 1. ??????????
- 2. ??????????
- 3. ????????
- ??????
- ???????
16
?????????????
17
?????????
????
??????
????????
????
???
??
??
???
???
18
?????????Linear Equations
??
??
19
??????1
????? Y 3 3/5 x
X Y
0 3
5 6
10 9
X???5????,Y??3???
20
??????1??
- ????? Y 3 3/5 x
X???5????,Y??3???
21
????????1
????? Y 3 3/5 x
X Y
0 3
5 6
10 9
20 ?
15
?X20?,Y?33/5 2031215
22
????????
- 1. ????????????????
???(Independent , explanatory variable)
????slope
???? Y-intercept
Y
X
b
b
e
i
i
i
0
1
???(Dependent response variable)
????Random error
23
?????????????
???? Random Sample
??Population
???????????
L
J
K
J
J
K
J
24
????????
???
ei ???? Random error
???
25
?????????????Sample Linear Regression Model
ei ??????
???????
???
26
??????????
(continued)
bo?b1??????(???Parameter)
(??????bo) ?
(??????b1)
????????(??)
? bo???
? b1???
27
??????????Regression Modeling Steps
- 1. ?????????????????
- 2. ???????
- 3. ??????????????
- ??????????
- 4. ????
- 5. ????????????
F
28
??????
X Y
10 20
20 40
30 10
35 20
40 60
50 60
??????? (X, Y) ?????
29
??? Scatter Plot
- 1. ????????? (Xi, Yi)????
- 2. ???????????????????
Y
60
40
20
0
X
0
20
40
60
30
??????
??????????????????????? ?????????????????????
31
??????
?????????????????????? ???????????????????
32
??????
?????????????????????? ????????????????????
33
??????
?????????????????????? ????????????????????
34
??????
?????????????????????? ????????????????????
35
??????
?????????????????????? ????????????????????
36
??????
?????????,???????,???????????????????????
37
?????????1
38
?????????2
39
????????
- ??????????
- \Content\Visual Explorations
- ??VisualExplorations
- Simple Linear Regression
- ?????????????????????????
40
??????????Least Squares Method Graphically
LS????
??
Y
e
4
e
2
e
e
1
3
X
41
?????Least Squares Method
- 1. ??? ????????????????
- ?????????????
- ????????????????
- 2. ??????????????(SSE)???
42
??????????1
?????????????
???????,???????
?
????,?????0
43
??????????2
????,?????0,?????
?????
44
??????????3
????,?????0,?????
?????
45
??????????4
??????????
?
????????
????????????
?????
46
?????????
?????
????????
????????
47
????????Computation Table
48
?????????
49
Excel???????
????
??? 5???
Sx, Sy, Sxy, Sx2, Sy2
??????SSx SSy Ssxy
???
???
50
Excel??????
???????
Sx185, Sy210, Sxy7400, Sx2 6725, Sy2 9700
5???
??SSx1835.714, SSy3400, SSxy1850
???
1850/1835.7141.008
???
210/7-1.008185/73.366
51
???????
- ????????????????????????????????????
- ???(??) ? ??? (??) 1 1 2 1 3 2 4 2 5 4
- ????????????
- ???
52
???????????Scattergram Sales vs. Advertising
???
????
53
????????
54
Excel??????
?????????
Sx15, Sy10, Sxy37, Sx2 55, Sy2 26
5???
SSx55-1515/510, SSy26-1010/56, SSxy
37-1510/57
???
7/100.7
???
10/5-0.715/5-0.1
55
????????
56
??????????Coefficient Interpretation Solution
- 1. ??Slope (b1)
- ??????(??)????(X)???????(E(Y))??0.7 (??)
- 2. ??Y-Intercept (b0)
- ??????????(X0)????(Y)??? -.10 (??)
- ????????????
- ?????????????
57
??????????Computer Output
- Parameter Estimates
- Parameter Standard T for H0
- Variable DF Estimate Error Param0
ProbgtT - INTERCEP 1 -0.1000 0.6350 -0.157
0.8849 - ADVERT 1 0.7000 0.1914 3.656 0.0354
58
???????
- ????????,?????????????????????,????????
- ???? (lb.) ??? (lb.) 4 3.0
6 5.5 10 6.5 12 9.0 - ??????????????????
59
?????????????Scattergram Crop Yield vs. Fertilizer
??? (lb.)
????(lb.)
60
??????????
61
Excel??????
?????????
?????
5???
SSx?????, SSy?????, SSxy ?????
???
?????
???
?????
62
????????
63
??????????Coefficient Interpretation Solution
- 1. ??Slope (b1)
- ???1 lb????(X)??????(Y)?? .65 ?(lb).
- 2. ??Y-Intercept (b0)
- ?????????(X)?????????0.8?(lb).
64
??????3
You want to examine the linear dependency of the
annual sales of produce stores on their size in
square footage. Sample data for seven stores were
obtained. Find the equation of the straight line
that fits the data best.
Annual Store Square Sales
Feet (1000) 1 1,726 3,681 2
1,542 3,395 3 2,816 6,653
4 5,555 9,543 5 1,292 3,318
6 2,208 5,563 7 1,313 3,760
65
????3-???
Excel Output
66
????3-?????
From Excel Printout
67
????3-????????
Yi 1636.415 1.487Xi
?
68
????3-????
????????1.487??,?X???1????,Y??????? 1.487????
??????,??????1????,?????????????????1487??? The
model estimates that for each increase of one
square foot in the size of the store, the
expected annual sales are predicted to increase
by 1487.
69
??PHStat???4??
- ????????????,?????????????????????????????????????
?12????????12?????????????????????????? - ?????Petfood??
70
??PHStat???4
- ??X?Y???
- ????????????
- ?????
- ??????????10??,??????sales
- ??12?????sales??2.6???1-4??,?????
71
??PHStat???4
- In excel, use PHStat regression simple linear
regression - EXCEL spreadsheet of regression sales on
Petfood(496?,??13.3)
72
??PHStat???5??
- ???????????,???????????????????????????????,??????
????????20????????20??????????????? - ?????Package??
73
??PHStat???5
- ??X?Y???
- ????????????
- ?????
- ??????????600???????????
- ???19???????14.77??,???????sales,???1-4?????
74
??PHStat???5
- In excel, use PHStat regression simple linear
regression - EXCEL spreadsheet of regression sales on
Petfood(496?,??13.4)
75
??????
- 1. ???????????
- 2. ???????????
- 3. ???????????
76
?????1
???
- The least squares method minimizes which of the
following? - a) SSR
- b) SSE
- c) SST
- d) All of the above
ANSWER b
77
?????2
???
- The Y-intercept (b0) represents the
- a) predicted value of Y when X 0.
- b) change in Y per unit change in X.
- c) predicted value of Y.
- d) variation around the line of regression.
ANSWER a
78
?????3
???
- The slope (b1) represents
- a) predicted value of Y when X 0.
- b) the average change in Y per unit change in X.
- c) the predicted value of Y.
- d) variation around the line of regression.
ANSWER b
79
?????4
???
- In performing a regression analysis involving two
numerical variables, we are assuming - a) the variances of X and Y are equal.
- b) the variation around the line of regression is
the same for each X value. - c) that X and Y are independent.
- d) all of the above.
ANSWER b
80
?????5
???
- The residuals represent
- a) the difference between the actual Y values and
the mean of Y. - b) the difference between the actual Y values and
the predicted Y values. - c) the square root of the slope.
- d) the predicted value of Y for the average X
value.
ANSWER b
81
?????6
???
- Which of the following assumptions concerning the
probability distribution of the random error term
is stated incorrectly? - a) The distribution is normal.
- b) The mean of the distribution is 0.
- c) The variance of the distribution increases as
X increases. - d) The errors are independent.
ANSWER c
82
???????
- TABLE 16-3
- The director of cooperative education at a state
college wants to examine the effect of
cooperative education job experience on
marketability in the work place. She takes a
random sample of four students. For these four,
she finds out how many times each had a
cooperative education job and how many job offers
they received upon graduation. These data are
presented in the table below.
Student CoopJobs JobOffer
1 1 4
2 2 6
3 1 3
4 0 1
83
???????1
Referring to Table 16-3, set up a scatter
diagram.
ANSWER
84
???????2
???
- the least squares estimate of the slope is
- __________.
- the least squares estimate of the Y-intercept is
__________. - the prediction for the number of job offers for a
person with 2 Coop jobs is __________. - the total sum of squares (SST) is __________.
ANSWER 2.50
ANSWER 1.00
ANSWER 6.00
ANSWER 13.00
Recommended
CrystalGraphics Presentations