Simple Linear Regression - PowerPoint PPT Presentation
1 / 26
Title:
Simple Linear Regression
Description:
Simple Linear Regression Purposes: To describe the linear relationship between two continuous variables: the response variable (y-axis) and a single predictor ... – PowerPoint PPT presentation
Number of Views:114
Avg rating:3.0/5.0
Title: Simple Linear Regression
1
Simple Linear Regression
2
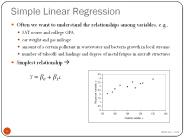
Purposes
- To describe the linear relationship between two
continuous variables the response variable
(y-axis) and a single predictor variable (x-axis) - To determine how much of the variation in Y can
be explained by the linear relationship with X
and how much of this relationship remains
unexplained - To predict new values of Y from new values of X
3
The linear regression model is
- ß0 population intercept (when Xi0)
- ß1 population slope (measures the change in Y
per unit change in X) - ei random or unexplained error associated with
the i th observation.
4
Linear relationship
Y
Yi
ß1
ei
1.0
ß0
Xi
X
5
Linear models may approximate non-linear
functions over a limited domain
extrapolation
extrapolation
interpolation
6
Y
µy2
µyi ßo ß1xi ei
µy1
X
x1
x2
Yi
Yi Yi ei (residual)
Yi
Fitting data to a linear model
Xi
7
The squared residual
The residual sum of squares
8
Estimating Regression Parameters
- The best fit estimates of the regression
population parameters (ß0 and ß1) are the values
that minimize the residual sum of squares (RSS)
between each observed value and the predicted
value of the model
9
Sum of squares
Sum of cross products
10
Sample Variance
Covariance
11
Least-squares parameter estimates
where
12
Solving for the intercept
Thus, our estimated regression equation is
13
Hypothesis Tests with Regression
- Null hypothesis is that there is no linear
relationship between X and Y - H0 ß1 0 ? Yi ß0 ei
- HA ß1 ? 0 ? Yi ß0 ß1 Xi ei
- We can use an F-ratio (i.e., the ratio of
variances) to test these hypotheses
14
Variance of the error of regression
NOTE this is also referred to as residual
variance, mean squared error (MSE) or residual
mean square (MSResidual)
15
Mean square of regression
The F-ratio is (MSRegression)/(MSResidual)
16
Variance components and the Coefficient of
Determination (r2 or R2)
17
Coefficient of determination
18
Pearsons product-moment correlation coefficient
(r)
19
ANOVA table for regression
Source Degrees of freedom Sum of squares Mean square Expected mean square F ratio
Regression 1
Residual n-2
Total n-1
20
Publication form of ANOVA table for regression
Source Sum of Squares df Mean Square F Sig.
Regression 11.479 1 11.479 21.044 0.00035
Residual 8.182 15 .545
Total 19.661 16
21
Variance of estimated intercept
22
Variance of the slope estimator
23
Variance of the fitted value
24
Regression
25
Assumptions of regression
- The linear model correctly describes the
functional relationship between X and Y - The X variable is measured without error
- For a given value of X, the sampled Y values are
independent with normally distributed errors - Variances are constant along the regression line
26
Residual plot for species-area relationship
Recommended
CrystalGraphics Presentations