
Figure 1. Map of the Santa Barbara Channel (SBC) and the Plumes and Blooms (PnB) study transect (x=station). The SBC marks the northern - PowerPoint PPT Presentation
1 / 21
Title: Figure 1. Map of the Santa Barbara Channel (SBC) and the Plumes and Blooms (PnB) study transect (x=station). The SBC marks the northern
1
Ventura R.
Santa Clara R.
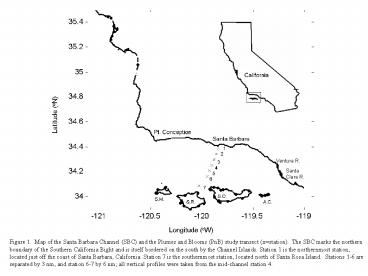
Figure 1. Map of the Santa Barbara Channel (SBC)
and the Plumes and Blooms (PnB) study transect
(xstation). The SBC marks the northern
boundary of the Southern California Bight and is
itself bordered on the south by the Channel
Islands. Station 1 is the northernmost station,
located just off the coast of Santa Barbara,
California. Station 7 is the southernmost
station, located north of Santa Rosa Island.
Stations 1-6 are separated by 3 nm, and station
6-7 by 6 nm all vertical profiles were taken
from the mid-channel station 4.
2
(a)
3
(b)
4
(c)
Nitrate (mM)
Figure 2. Time-station contours of (a)
temperature (C), (b) salinity (ppt), and (c)
nitrate (mM) along the 7-station PnB transect
from September 1998 to August 2003. Vertical
profiles (0-75 m) were taken at station 4 only
(fig. 1). Gaps in contours are due to
instrument failure.
5
(a)
6
(b)
7
(c)
8
(d)
9
Figure 3. Time-station contours of selected
diagnositc phytoplankton pigments sampled along
the PnB transect from September 1998 to August
2003. (a) Chlorophyll-a total biomass (a)
fucoxanthin diatoms, (b) peridinin
dinoflagellates, (d) 19-hexanoyloxyfucoxanthinha
ptophytes, (e) 19-butanoyloxyfucoxanthin
chrysophytes.
10
(a)
11
(b)
Figure 4. The first four empirical
orthogonal function (EOF) modes for eleven
diagnostic phytoplankton pigments measured from
September 1998 to August 2003 (n474). (a) The
proportion of total variance explained by each
mode. Numbers above each bar are the r2 values
between each pigment and the respective EOF
mode. Pigment Abbreviations chlorophyll-a,
zeaxanthin, chlorophyll-b, prasinoxanthin,
lutein, violaxanthin, alloxanthin,
19-hexanoyloxyfucoxanthin, 19-butanoyloxyfucoxa
nthin, peridinin, fucoxanthin, total chlorophyll.
(b) Time-station contoured distributions of the
EOF amplitude time series. Station 7 is the most
southern and offshore location. Note that
amplitude signs for Mode 3 have been reversed to
show peridinin (dinoflagellate) increases as
positive (red) amplitudes.
Mode 1
Mode 2
Plumes and Blooms Station
(-) Mode 3
Mode 4
12
Table 1. Correlation coefficients (r) with n-2
degrees of freedom (DF) and 99 confidence limits
for the major phytoplankton pigment EOF modes
and discrete surface water properties.
13
(a)
(b)
Plumes and Blooms Station
Year
Day of Year
Figure 5. Time/space points for the upper 3
(n15) positive and negative amplitudes for EOF
pigment modes 1-4, shown for (a) the entire study
period and (b) by seasonal occurrence.
Bluepositive and Rednegative magnitudes. Note
that for mode 3, red amplitudes represent the
dinoflagellate-favored state.
(working on grayscale version of these plots)
14
Table 2. Extremes/Phys WMW-test Table See Word
version
15
Table 3. Size-Class and CHEMTAX Specs See Excel
version
16
(a)
Size-Class Groupings
Pico
Nano
Micro
Proportion of Each Phyto Class to Total Biomass
CHEMTAX Classes
Diatoms
Haptophytes
Chlorophytes
Cryptophytes
Prasinophytes
Chrysophytes
Cyanobacteria
Dinoflagellates
17
Size-Class Groupings
(b)
Pico
Nano
Micro
Proportion of Each Phyto Class to Total Biomass
CHEMTAX Classes
Diatoms
Haptophytes
Chlorophytes
Cryptophytes
Chrysophytes
Cyanobacteria
Prasinophytes
Dinoflagellates
18
(c)
Size-Class Groupings
Proportion of Each Phyto Class to Total Biomass
Pico
Nano
Micro
CHEMTAX Classes
Diatoms
Prasinophytes
Haptophytes
Chlorophytes
Cryptophytes
Chrysophytes
Cyanobacteria
Dinoflagellates
19
(d)
Size-Class Groupings
Proportion of Each Phyto Class to Total Biomass
Pico
Nano
Micro
CHEMTAX Classes
Diatoms
Chlorophytes
Haptophytes
Cryptophytes
Chrysophytes
Cyanobacteria
Prasinophytes
Dinoflagellates
20
(e)
Size-Class Groupings
Proportion of Each Phyto Class to Total Biomass
Pico
Nano
Micro
CHEMTAX Classes
Diatoms
Haptophytes
Chlorophytes
Cryptophytes
Chrysophytes
Prasinophytes
Cyanobacteria
Dinoflagellates
Figure 6. The average phytoplankton community
structure for surface samples at the extremes of
the first four EOF modes represented as (a)
pre-bloom (b) diatom bloom (c)
dinoflagellate bloom (d) transition state
when nanoflagellates dominate, and (e)
transition state when pico-plankton dominate.
Error bars represent one standard deviation.
Traditional chemotaxonomic, size-class groupings
and the CHEMTAX approach (Table 3) show good
agreement with one another and with their
respective EOF pigment modes (see Fig. 4a).
21
Figure 7. The distribution of surface
concentrations of the diagnostice dinoflagellate
pigment, perdinin, from a September 2004 SBC-LTER
channel-wide cruise. Solid points represent the
25 sampling stations. Elevated perdinin
concentrations are isolated to a single patch
close to the Santa Barbara mainland.
Recommended
CrystalGraphics Presentations


