
Descriptive Columbia River estuary and plume II - PowerPoint PPT Presentation
Title:
Descriptive Columbia River estuary and plume II
Description:
Oceanic diatoms Myrionecta rubra Freshwater diatoms Riverine phytoplankton: washed down river, ... develops blooms within the estuary, mobile Oceanic diatoms: ... – PowerPoint PPT presentation
Number of Views:108
Avg rating:3.0/5.0
Title: Descriptive Columbia River estuary and plume II
1
Descriptive Columbia River estuary and plume II
EBS566 Estuary and Ocean Systems II Lecture 6,
Winter 2010 Instructors T. Peterson, M. Haygood,
A. Baptista Division of Environmental and
Biomolecular Systems, Oregon Health Science
University
2
Plume regions
Summary by David Jay of research by A.
Horner-Devine et al.
3
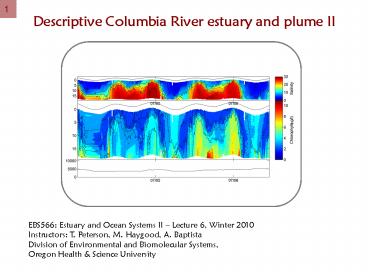
Salinity intrusion
Salinity (psu)
Tide range (m)
Q (m3/s)
am169
4
Biology in context?
Oceanic diatoms
- Riverine phytoplankton washed down river, lyse
in saline water - Myrionecta rubra develops blooms within the
estuary, mobile - Oceanic diatoms washed into the estuary,
generally tolerant of low salinity water
Freshwater diatoms
Myrionecta rubra
Slide by Charles Seaton
5
Internal waves
A SAR image taken at 015627 GMT, July 8, 2007
showing the surface roughness as a manifestation
of IWs in the Columbia River estuary
Spatial coverage of the radar from the bridge
(right) to the river mouth (left) (background
courtesy of Google Earth). The red rectangle
shows the approximate location of the internal
waves. Middle Photo of the internal waves taken
from the deck of the R/V Pt. Sur at 1600 PDT on
September 8, 2009 (courtesy of Craig McNeil).
Bottom image produced from radar data showing
the internal waves at 1740 PDT on the same day.
The intensity dB (100V)2 is related to internal
wave amplitude while the spacing indicates
wavelength.
6
Salinity intrusion length
(a) Data collected by David Jay on LMER and NOAA
cruises
Chawla, Jay, Baptista, Wilkin and Seaton, CSR 2008
Predicable (with some challenges)
(b) Salinity in psu at an upstream station (data
in red, model in black, blue and magenta)
6.8
0.0
Aug 26, 2004
27
28
29
30
31
Sep 1
2
7
Salinity intrusion length
Responsive SIL has a clear response to river
discharge
8
Salinity intrusion length
Responsive relatively easy to characterize
(noise is useful to characterize other
influences)
SIL2psu 5.949Q-0.288 r20.823
SIL (Km)
Based on DB16
River discharge, Q (m3/s)
9
Freshwater diatoms?
Slide by Charles Seaton
10
Oceanic and freshwater diatoms?
Oceanic diatoms
Freshwater diatoms
Slide by Charles Seaton
11
Myrionecta rubra?
Slide by Charles Seaton
12
What are internal waves
- Internal waves are gravity waves that oscillate
within, rather than on the surface of, a water
body in association with a stratified fluid in
motion
Slide by Jiayi Pan
13
How are estuarine internal waves generated in the
CR?
CRE bottom topography is a key factor for
generation of internal waves
Internal waves
25 m
2 km
Lee wave is the generation mechanism Flood tide
current interacts with the bottom topography to
generate internal waves
Slide by Jiayi Pan
14
Internal waves in Columbia River estuary (CRE)
Why are estuarine internal waves important in the
CR?
Internal waves can cause vertical velocity shear,
which can intensify vertical mixing process
Not a representation of the CR
Through vertical mixing in the North Channel,
internal waves may be quite important for the
ecology of the Columbia River Estuary (CRE). In
particular, internal waves may substantially
modulate ocean influences, which are felt
predominantly through the North Channel
Slide by Jiayi Pan
15
Why do we see surface signatures of internal
waves?
Internal waves
Slide by Jiayi Pan
16
Internal waves in Columbia River estuary (CRE)
Can we see internal waves in fixed station
records ?
am12 ADCP U velocity ( Saturn 01 Location)
am12 ADCP U velocity
horizontal Velocity (east-west) Tides dominate
After removing tidal signals U velocity
Tidal Residual horizontal velocity
Internal waves
Internal waves
Slide by Jiayi Pan
17
Characteristics of internal waves in the CR
The statistics of CRE internal waves from 10 SAR
images showing internal waves
There are 107 waves in these images
Wavelength distribution
Statistical Results of the wavelength
Number of Internal waves 107
Mean wavelength 92.0 (m)
Median 84.3 (m)
Standard Deviation 29.5 (m)
Wavelength Range 157.5 (m)
Minimum wavelength 39.7 (m)
Maximum wavelength 197.2 (m)
Slide by Jiayi Pan
18
Internal waves in Columbia River estuary (CRE)
Characteristics of internal waves in the CR
SAR image Date and Time (UTC) (showing Internal waves) Tide Time after LW (hrs) Tidal amplitude (m) River outflow Beaver (m3/s)
2005-03-03 015700 early ebb 7.3 1.26 3, 964
2005-06-14 015307 early ebb 7.2 1.59 5, 975
2006-07-03 015230 early ebb 7.2 1.57 5, 777
2006-07-20 015640 flood 5.1 1.58 5, 352
2007-05-11 015220 flood 5.4 1.66 8, 976
2007-08-07 143552 flood 5.3 1.34 4, 390
2007-08-08 015627 flood 5.3 1.33 4, 276
2007-09-07 143142 flood 3.0 1.78 3, 313
2008-07-14 190523 early ebb 7.0 1.55 N/A
2008-08-18 190521 flood 3.8 2.19 N/A
Slide by Jiayi Pan
19
Early modeling
Credit Joseph Zhang
Recommended
CrystalGraphics Presentations


