
GIS spatial modeling Mapping Potential Terrorist Havens in the Middle East - PowerPoint PPT Presentation
Title:
GIS spatial modeling Mapping Potential Terrorist Havens in the Middle East
Description:
GIS spatial modeling Mapping Potential Terrorist Havens in the Middle East Introduction Terrain Complexity using Fuzzy Suitability using MCE Model – PowerPoint PPT presentation
Number of Views:29
Avg rating:3.0/5.0
Title: GIS spatial modeling Mapping Potential Terrorist Havens in the Middle East
1
GIS spatial modeling Mapping Potential
Terrorist Havens in the Middle East
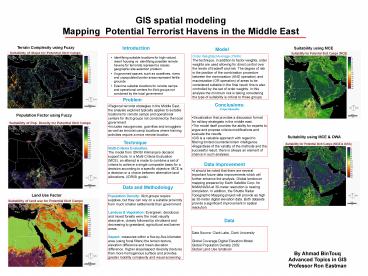
Introduction
Terrain Complexity using Fuzzy
Suitability using MCE
Model
- Identifying suitable locations for high-valued
resort housing vs. identifying possible remote
havens for terrorists represent a classic
geographic site-selection problem - Ungoverned spaces, such as coastlines, rivers and
unpopulated border areas represent fertile
grounds - Examine suitable locations for remote camps and
operational centers for illicit groups not
condoned by the local government
Order Weighted Average (OWA) The technique, in
addition to factor weights, order weights are
used allowing for direct control over the levels
of tradeoff and risk. The degree of risk is the
position of the combination procedure between the
minimization (AND operation) and maximization (OR
operation) of areas to be considered suitable in
the final result this is also controlled by the
set of order weights. In this analysis the
minimum risk is taking considering the type of
suitability is critical to those groups.
Problem
Conclusions Project Benefits
- Regional terrorist strategies in the Middle East,
the analysis explored typically applies to
suitable locations for remote camps and
operational centers for illicit groups not
condoned by the local government. - Includes insurgencies, guerrillas and smugglers
as well as terrorist camp locations where
training activities require a more remote
location.
Population Factor using Fuzzy
- Visualization that provides a discussion format
for military strategists in the middle east. - The model itself provides the ability for experts
to argue and propose criteria modifications and
evaluate the results. - GIS is a valuable approach with regard to
filtering limited counterterrorism intelligence. - Regardless of the validity of the methods and the
successful result, there is always an element of
chance in such analyses.
Suitability using MCE OWA
Technique
Multi-Criteria Evaluation The model from IDRISI
Kilimanjaro decision support tools. In a
Multi-Criteria Evaluation (MCE), an attempt is
made to combine a set of criteria to achieve a
single composite basis for a decision according
to a specific objective. MCE is a decision or a
choice between alternative land
allocations..(IDRISI guide)
Data Improvement
- It should be noted that there are several
important future data improvements which will
further enhance the analysis. Global landcover
mapping prepared by Earth Satellite Corp. for
NIMA/NASA at 30-meter resolution is nearing
completion. In addition, the Shuttle Radar
Topographic Mapping project will provide as high
as 30-meter digital elevation data. Both datasets
provide a significant improvement in spatial
resolution.
Data and Methodology
Land Use Factor using Fuzzy
Population Density Illicit groups require
supplies, but they can rely on a suitable
proximity from much smaller settlements than
government Landuse Vegetation Evergreen,
deciduous and mixed forests were the most
visually absorptive, closely followed by
shrubland and decreasing to grassland,
agricultural and barren areas. Aspect measures
within a five-by-five-kilometer area (using focal
filters) the terrain texture, elevation
difference and mean elevation difference. Higher
slope/aspect diversity (texture) than more
homogenous surface and provides greater mobility
complexity and visual screening
Data
Data Source Clark Labs, Clark
University . Global Coverage Digital Elevation
Model Global Population Density 2002 Global Land
Use landscan
By Ahmad BinTouq Advanced Topics in GIS Professor
Ron Eastman
Recommended
CrystalGraphics Presentations


