
Perspectives on Nanoscience - PowerPoint PPT Presentation
1 / 61
Title: Perspectives on Nanoscience
1
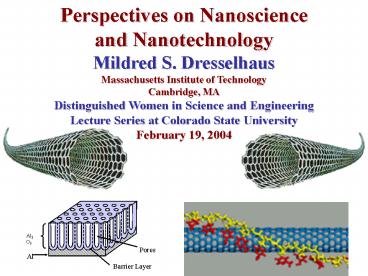
Perspectives on Nanoscience and Nanotechnology
Mildred S. Dresselhaus Massachusetts Institute
of Technology Cambridge, MA Distinguished Women
in Science and Engineering Lecture Series at
Colorado State University February 19, 2004
2
Outline
- Broad overview of nanoscience and nanotechnology
- One-dimensional nanostructures
- Nanowire structure and properties
- Carbon nanotubes as 1D model systems
- Role of nanostructures in the Hydrogen Economy
3
The Incredible Tininess of Nano
Nanometers Ten shoulder-to-shoulder hydrogen
atoms span 1 nanometer. DNA molecules are about
2.5 nanometers wide.
A million nanometers The pinhead sized patch of
this thumb is a million nanometers across.
Billions of nanometers A two meter tall male is
two billion nanometers.
Thousands of nanometers Biological cells have
diameters in the range of thousands of nanometers.
Less than a nanometer Individual atoms are up to
a few tenths of a nanometer in diameter.
1 nm is 100,000 times smaller than a human hair
4
Science Introduction
- Nanostructures (lt 30 nm) have become an exciting
research field - New quantum phenomena occur at this length scale
- New structure property relations are expected
- Promising applications are expected in optics,
electronics, thermoelectric, magnetic storage,
NEMS (nano-electro-mechanical systems) - Large surface to volume ratios lead to
applications, such as in catalysis. - Low-dimensional systems are realized by creating
nanostructures that are quantum confined in one
or more directions
D. O. S.
D. O. S.
D. O. S.
D. O. S.
3D Bulk Semiconductor
2D Quantum Well
1D Quantum Wire
0D Quantum Dot
5
CUTTING LINES
Energy-momentum contours ( linear dispersion
degenerate point )
a
b
c
Pre-resonant conditions (cutting lines DOS
profile)
Ge. G. Samsonidze et al., J. Nanosci. Nanotech.
3, 431 (2003)
6
Context Nanotechnology in the WorldGovernment
investments 1997-2002
Note
- U.S. begins FY in October, six month before EU
Japan in March/April - U.S. does not have a commanding lead as it was
for other ST megatrends(such as BIO, IT, space
exploration, nuclear)
Senate Briefing, May 24, 2001 (M.C. Roco),
updated on February 5, 2002
7
The incredible shrinking disk drive for data
storage
1956 IBM Ramac 305 vs. 2000 IBM
Microdrive 5 MB 1 GB 50 x 24
dia. disks 1 x 1 disk
weighs a ton lt 1 oz. 50,000
500
8
Decreasing Head/media spacing
Example of Moores law
9
Magnetic Recording at the Nanoscale
- Simplest Case of Giant Magnetoresistance
- and spin valve technology
scattering of majority electrons shown in film
cross-section
Anti-Ferromagnetic Pinning Layer
Anti-Ferromagnetic Pinning Layer
.
.
.
.
e-
e-
MPINNED
MPINNED
Pinned Layer
.
.
Cu Spacer
MFREE
MFREE
e-
Free Layer
e-
Lowest Resistance Parallel State
Higher Resistance Perpendicular State
Sense Current Direction
Active layer is 15-25 nm thick
Picture from Allan Shultz, Seagate Technology
10
Quantum Dots
Ni-alloy evaporated pyramids Size 30 nm
(Caroline Ross and Hank Smith, MIT)
11
A Nano Tool-box
- To fabricate/probe nanostructures
- Nanofabrication
Bottom-up Method - self assembly of atoms or
molecules into nanostructures
Top-down Method - create nanostructures out of
macrostructures
Bottom-up method introduced by Richard Feynman
in 1959 lecture Theres plenty of room at the
bottom.
12
Various Bi Nanostructures All are one-dimensional
and all are Bi
(a) Bi Nanowire
(b) Bi Nanotube
(c) Bi Atomic Line
Dresselhaus Group
K. Miki
X.Y. Liu et al.
13
Wiring on Si with ultra-fine Bi linesStructure
different from 3D Bismuth
Bi nanoline
- Features
- over 300 nm long
- 1 nm (3 Si dimers) wide
- without kink
- in terrace (not on top layer)
Example of self-assembly
K. Miki et al. Surf. Sci. 421 (1999) 397
14
Bi Nanotubes Unit Cell like 3D bismuth
C. Su et al., Nanotech. 13 (2002) 746
Rolling of x-y plane Along same axis x.
X.-Y. Liu et al., Chem. Phys. Lett. 374 (2003) 348
15
Self-Assembled Nanopores in Aluminafor growing
nanowires/nanotubes
SEM image of the surface of an anodic alumina
template with self-assembled nanopore structure
1010 1011 pores/cm2
- Applications
- Templates for ordered arrays of nanowires and
nanotubes - 2D photonic crystal
- High density magnetic storage media
- Filters and gas sensors
Template Dissolution
16
Single Crystal Nanowires
X-ray diffraction of Bi nanowire arrays with
different diameters.
10 nm
TEM and electron diffraction of a 40-nm nanowire
(Bi0.85Sb0.15)
17
Quantum Confinement Produces New Materials Classes
- Bi
- Group V element
- Semimetal in bulk form
- The conduction band (L-electron) overlaps with
the valence band (T-hole) by 38 meV
- Bi nanowire
- Semimetal-semiconductor transition at a wire
diameter about 50 nm due to quantum confinement
effects
Semimetal-Semiconductor Transition new physics
18
Semimetal-Semiconductor Transition in Bi1-xSbx
(SM-SC)
- Sb alloying
- Group V element
- Complete solubility with Bi
- Moves down the T-point valence band edge in
energy relative to the L-point carriers
- Bi
- Group V element
- Semimetal in bulk form
- The conduction band (L-electron) overlaps with
the valence band (T-hole) by 38 meV (77 K)
Bulk Bi
L-electron
T-hole
Decreasing wire diameter Increasing Sb
concentration
Semiconductor
Semimetal
Lin et al., Phys. Rev. B 62, 4610 (2001) Rabin et
al., Appl. Phys. Lett. 79, 81 (2001)
19
Electronic Phases of 3D 1D Bi1-xSbx
Phase diagram of Bi1-xSbx nanowires
Electronic phases of bulk Bi1-xSbx alloy
Rabin et al., Appl. Phys. Lett. 79, 81 (2001)
20
Segmented Nanowires for Thermoelectric
Applications
Superlattice (2D)
Nanowire (1D)
Segmented Nanowire (0D)
Electron transmitting
Phonon blocking
Y. M. Lin in Dresselhaus group
21
Lieber et al., Nature 415 (2002) 617
nanowire
catalyst
Vapor-liquid-solid growth
Gas phase reactants are introduced sequencially
and cycled periodically.
A GaAs B GaP
22
Samuelson et al., Nano Lett. 2 (2002) 87
23
Growth of Semiconductor Nanowiresby VLS method
50 nm
5 ?m
Laser ablation overcomes thermodynamic
equilibrium constraints, and enables liquid
nanocluster formation.
- FESEM image of GaP nanowires. The inset is a TEM
image of the end of one of these wires. - TEM image of a GaP wire. The 111 lattice planes
are resolved, showing that wire growth occurs
along this axis. - Gold nanoparticles are highly resistive in
contrast to bulk gold.
10 nm
Lieber et al., JACS 122 (2000) 8801
24
ZnO Nanowires on Sapphire by VLS
method (self-assembly)
SEM images of ZnO nanowire arrays grown on a
sapphire substrate, where (a) shows patterned
growth, (b) shows a higher resolution image of
the parallel alignment of the nanowires, and (c)
shows the faceted side-walls and the hexagonal
cross-section of the nanowires. For nanowire
growth, the sapphire substrates were coated with
a 1.0 to 3.5nm thick patterned layer of Au as the
catalyst, using a TEM grid as the shadow mask.
These nanowires have been used for nanowire laser
applications (Huang et al., 2001a). Patterned
growth can be arranged. Proper selection of
nanowires and substrate materials can lead to
facets, useful for nanowire lasers.
P. Yang et al., Science 292 (2001) 1897
25
Nano-Lasers using ZnO Nanowires
Nanowire UV Nanolaser
UV Laser Output
ZnO nanowires grown by VLS method.
Excitation
Nanowire diameter much smaller than wavelength of
light.
Emission spectrum from ZnO nanowires.
P. Yang et al., Science 292 (2001) 1897
26
Tunable Bandgap in Nanowires
InP nanowire diameter ? energy ?
M. S. Gudiksen et al., J. Phys. Chem B 106, 4036
(2002)
27
Quantum Confinement in Si Nanowires
STM of Si nanowire
Ma et al., Science 299, 1874 (2003)
- STM studies show that Si nanowires grow
- along (110) and (112) directions.
- STS studies give I-V curves, and (dI/dV)/(I/V)
- gives DOS and Eg vs tube diameter.
28
Luminescence from InP Nanowire Junctions
PL
EL
I-V
Optoelectrical characterization of a crossed
nanowire junction formed between 65-nm n-type and
68-nm p-type InP nanowires. (a)
Electroluminescence (EL) image of the light
emitted from a forward-biased nanowire p-n
junction at 2.5 V. Inset, photoluminescence (PL)
image of the junction. (b) EL intensity as a
function of operation voltage. Inset, the SEM
image and the I-V characteristics of the junction
(Duan et al., 2001). The scale bar in the inset
is 5 microns. Lieber et al., Nature 409 (2001) 66
29
Logic Functions Demonstrated by crossed Si and
GaN Nanowires
OR
Lieber et al., Science 294 (2001) 1313
AND
Nanowire logic gates (a) Schematic of logic OR
gate constructed from a 2(p-Si) by 1(n-GaN)
crossed nanowire junction. The inset shows the
SEM image (bar 1 microns) of an assembled OR
gate and the symbolic electronic circuit. (b) The
output voltage of the circuit in (a) versus the
four possible logic address level inputs (0,0)
(0,1) (1,0) (1,1), where logic 0 input is 0V
and logic 1 is 5V (same for below). (c) Schematic
of logic AND gate constructed from a 1(p-Si) by
3(n-GaN) crossed nanowire junction. The inset
shows the SEM image (bar 1 microns) of an
assembled AND gate and the symbolic electronic
circuit. (d) The output voltage of the circuit in
(c) versus the four possible logic address level
inputs (Huang et al., 2001).
30
Unique Properties of Carbon Nanotubes
Roll up
Graphene sheet
SWNT
- Size Nanostructures with dimensions of 1 nm
diameter (20 atoms around the cylinder) - Electronic Properties Can be either metallic or
semiconducting depending on the tube diameter or
orientation of the hexagons - Mechanical Very high strength and modulus. Good
properties on compression and extension - Heat pipe and electromagnetic pipe
- Single nanotube spectroscopy yields structure
- Many applications are being attempted worldwide
31
Synthesis S. Iijima, Nature 354 56 (1991)
Arc Method Y. Saito
Arc Discharge Laser
Ablation
5-20mm diameter carbon rod
Nd-Yb-Al-garnet Laser, 1200
500torr He
50-120A DC
Y. Saito et al. Phys. Rev. 48 1907 (1993)
A. Thess et al. Science 273 483 (1996)
32
(No Transcript)
33
Smallest Nanotube N. Wang et al. Nature 408, 50
(2000)
- Chirality (5,0), (3,3), (4,2)
- Diameter 0.42 nm
- 10 Carbon atoms along Ch in (5,0)
- Isolated Aligned tubes
- Metallic electronic structure
- TEM, Electron diffraction
- Photo Luminescence
- Raman Spectra
- Superconductivity (15 K)
(5,0) zigzag nanotube same diameter as C20
fullerene
34
Applications for NanotubesScanning tips and
Electronics
Field Emitter
- STM/AFM tips
- Direct Analysis of DNA
- Semiconductor devices
- Field Emitters
Transistor
Imaging biological molecules
AFM image of Immunoglobulin G resolved by
nanotube tips
35
Rolling up graphene layer
Nanotube
armchair
zigzag
(4,2)
chiral
Met n - m 3q Sem n - m 3q ? 1 twice as
many Sem as Met Each (n,m) is a different molecule
36
STM/STS Experiments
P. Kim et al., Phys. Rev. Lett. 82, 1225 (1999)
cutting lines (13,7)
1mm
J. W. G. Wildoer et al., Nature 391, 59 (1998)
37
Phonons in single wall carbon nanotubes
Main Features
(10,10) Brillouin Zone
Graphite Brillouin Zone
Radial Breathing Mode (RBM)
DOS
DOS
(Figs. From Prof. R. Saito)
Zone folding of graphene sheet
Raman Spectra of SWNTs
Tangential Modes (G-band)
G-band
- Raman active modes
- Chiral 15
- Zigzag 15
- Armchair
- Even n 16
- Odd n 15
Raman Intensity
RBM
0 500 1000 1500
Frequency (cm-1)
38
Raman Spectroscopyof Carbon Nanotubes M. S.
Dresselhaus and P. C. Eklund,Advances in Physics
49 705 (2000)
C. V. Raman
- Non-destructive, contactless measurement
- Room Temperature
- In Air at Ambient Pressure
- Quick (1min), Accurate in Energy
- Diameter Selective (Resonant Raman Effect)
- Diameter and Chirality dependent phonons
- Characterization of (n,m)
- Related to Low Dimensional Physics
39
Resonant Raman Spectroscopy A. M. Rao et al.,
Science 275, 187 (1997)
Raman spectra from nanotube bundles
- Enhanced Signal
- Optical Absorption
- e-DOS peaks
E 0.94eV 1.17eV 1.58eV 1.92eV
2.41eV
diameter-selective resonance process wRBM a / dt
40
Resonant Raman Spectra of Carbon Nanotube
Bundles M. A. Pimenta et al., Phys. Rev. B 58,
R16016 (1998)
Diameter dependence of the Van-Hove singularities
G-band resonant Raman spectra
laser energy
G-band
dt 1.37 0.18 nm
41
Single Nanotube Spectroscopy
Resonant Raman spectra for isolated single-wall
carbon nanotubes grown on Si/SiO2 substrate by
the CVD method
A. Jorio et al., Phys. Rev. Lett. 86, 1118 (2001)
RBM
'
Metallic
(n,m) identification wRBM248/dt Eii Elaser
Semiconducting
Raman signal from one SWNT indicates a strong
resonance process Otherwise it would not be
possible to observe spectra
42
Single nanotube Raman spectroscopy
(n,m), JDOS, Eii Resonant Raman window
to compare directly experiments and theory on
(n,m) SWNTs
(Fig. From Prof. S. G. Louie)
to perform different experiments and to build
devices on a characterized (n,m) SWNT
to improve the knowledge about the nanotube
spectroscopy improvement on characterization
capability
43
Raman Spectra and Transport for One SWNT
- AFM dt 1-2nm gt single tube.
- No voltage applied to sample during Raman
Spectroscopy.
wRBM 185 cm-1 ? dt 1.34 nm
S. B. Cronin et al., Appl. Phys. Lett. (2004) in
press
44
Electrochemical Gating of Single Nanotube
laser
H2SO4 solution
- Because of a large surface to volume ratio,
nanotubes are very sensitive to guest chemical
species on its surface. - By applying a voltage in an electrolytic
solution, the Fermi energy of the nanotube can be
changed.
S. B. Cronin et al., Appl. Phys. Lett. (2004) in
press
45
Challenges for Carbon Nanotube Research
- Control synthesis process to produce tubes with
same diameter and chirality - Until control of synthesis process is achieved,
develop effective separation methods - metallic from semiconducting
- by diameter
- by chirality
- Develop method for large-scale, cheap synthesis
- Improve nanotube characterization and
manipulation - Develop commercial scale applications
46
A CHEMICAL SEPARATION PROCESS For semiconducting
and metallic SWNTs
Acid-treated SWNTs were non-covalently functionali
zed with octadecylamine (ODA) and dispersed in
tetrahydrofuran (THF) Partially evaporate THF ?
M-SWNTs selectively precipitate S-SWNT enriched
supernatant (currently attributed to an
enhanced chemical affinity of ODA for S-SWNTs,
rendering M-SWNTs more prone to
precipitation) Remove ODA by vacuum sublimation
D. Chattopadhyay, I. Galeska, F.
Papadimitrakopoulos, J. Am.
Chem. Soc. 125, 3370 (2003)
47
SEPARATION EFFICIENCY
for ODA-assisted process
Evaluate (MS) ratios and mean diameters by
resonance Raman spectroscopy (RRS) Compare
radial-breathing mode (RBM) Raman features before
and after separation
precipitant (pp) and supernatant (sn)
fractions metallic (M) and semiconducting (S)
SWNTs small (s) and large (L) sampling diameters
s 0.93 nm L 1.30 nm
Metallic ? by 20 in
precipitant Semiconducting ? 4 times in
supernatant
Ge. G. Samsonidze et al., Appl. Phys. Lett.
(submitted)
48
DNA SEPARATION PROCESS
Ming Zheng et al. DuPont Central Research and
Development
M. Zheng et al., Nature Materials 2, 338
(2003). M. Zheng et al., Science, 302,1546,
Nov28th, 2003.
Evidence for individual SWNT/DNA species
DNA-assisted dispersion of HiPCo SWNTs
- Single-stranded DNA and HiPco SWNTs in water in
the presence of a denaturant - Mild sonication in an ice water bath
?optical spectra showing discrete SWNTs
?strong near-IR fluorescence
DNA-SWNT solutions (Chromatography)
Fluorescence
- stable for months
- evidence of supramolecular
- self-assembly of DNA on a SWNT
F00
F34
F37
F40
Raman shift (cm-1)
49
DNA SEPARATION PROCESS
Ming Zheng et al. DuPont Central Research and
Development
M. Zheng et al., Science, 302,1546, Nov28th, 2003.
load sample
add eluant
Ion-exchange liquid chromatography
- Sample ?
- Stationary
- Phase ?
- Eluant ?
500 ?L of a DNA-SWNT strong anion exchange
resin positively charged aqueous solution with
linear salt concentration (0 to 0.9M NaSCN in 20
mM MES buffer at pH7)
column containing stationary phase
collect samples
Separation mechanism
- Hybrid DNA-SWNTspecies
- different linear charge densities
- Met tubes lower negative charge density
- higher polarizability ? positive image
charge - elute before Sem tubes from the column
- Small diameter tubes elute before large
diameter SWNTs
Analyzed samples
F00 (starting material), F34, F37, F40, F43
(DNA-SWNTs)
50
SEPARATION EFFICIENCY
for DNA-assisted process
Evaluate (MS) ratios without knowing diameter
distribution by RRS Compare radial-breathing mode
(RBM) Raman features before and after separation
Sem n - m 3q ? 1 Met n - m 3q
twice as many Sem as Met
We approximate the ratio for all diameters by the
ratios for dS and dL observed experimentally
V. W. Brar et al., unpublished
51
Separation Efficiency of DNA-wrapped SWNTs
- The DNA-assisted Separation Process
- Met vs. Sem separation and
- diameter separation
- Procedure for evaluating separation efficiency
- of Sem and Met SWNTs was developed using
- resonance Raman spectroscopy
- Enhancement of Met in the earlier fraction 6
times - Enhancement of Sem in the later fraction 2
times - Diameter separation in DNA Process
- Small diameter tubes in earlier fractions
- Large diameter tubes in later fractions
52
Drivers for the Hydrogen Economy
- Reduce Reliance on Fossil Fuels (finite
resource) - Reduce Accumulation of Greenhouse Gases
(environmental)
53
The Hydrogen Economy (renewable)
gas or hydride storage
54
- Fossil Fuel Reforming in Hydrogen Production
- For the next decade or more hydrogen will mainly
be produced using fossil fuel feedstocks. - Development of efficient inexpensive catalysts
will be key. - Modeling and simulation will play a significant
role.
Inspired by quantum chemical calculations, Ni
surface-alloyed with Au (black) on the left is
used to reduce carbon poisoning of catalyst, as
verified experimentally on the right.
55
- Solar Photoelectrochemistry/Photocatalysis
- for H2 Production
- Power conversion efficiency (10) needs to be
increased by reducing losses. - Spectral response needs to be extended into the
red - Costs need to be reduced in the production of the
transparent anode. - Low cost TiO2 porous nanostructures allow deep
light penetration into dye-sensitized solar cells
to increase their efficiency.
Photochemical solar cells or Grätzel cells use
cheap porous TiO2 with a huge surface area (see
right). Dye additives allow absorption of visible
light to better match solar spectrum (left).
56
Hydrogen Storage
- Current Technology for automotive applications
- Tanks for gaseous or liquid hydrogen storage.
- Progress demonstrated in solid state storage
materials. - System Requirements
- Compact, light-weight, affordable storage.
- System requirements set for FreedomCAR 4.5 wt
hydrogen for 2005, - 9 wt hydrogen for 2015.
- No current storage system or material meets all
targets.
57
High Gravimetric H Density Candidates
Based on Schlapbach and Zuttel, 2001
Both storage and kinetics are important
58
Carbon Nanotubes for Hydrogen Storage
- The very small size and very high surface area
of carbon nanotubes make them interesting for
hydrogen storage. - Challenge is to increase the HC stoichiometry
and to strengthen the - HC bonding at 300 K.
- ? HC 1 ? 8 wt hydrogen
A computational representation of hydrogen
adsorption in an optimized array of (10,10)
nanotubes at 298 K and 200 Bar. The red spheres
represent hydrogen molecules and the blue spheres
represent carbon atoms in the nanotubes, showing
3 kinds of binding sites. (K. Johnson et al)
59
- Theory and Modeling
- AlH4 is light weight with high potential storage
capacity but the kinetics for hydrogen release
are too slow. - Calculations allow exploration of strategies to
achieve bonding for H2 release close to room
temperature
First principles density functional theory shows
that neutral AlH4 dissociates into AlH2 H2 but
that ionized AlH4- tightly binds 4
hydrogens. Calculations further show that Ti
substitutes for Na in NaAlH4 and weakens the Al-H
ionic bond, thus making it possible to lower the
temperature of H2 desorption from 200C to 120C.
(unpublished calculations of P. Jena,
co-chair of Hydrogen Storage Panel).
60
Messages of DOE Hydrogen Report
- Enormous gap between present state-of-the-art
capabilities and requirements that will allow
hydrogen to be competitive with todays - energy technologies
- production 9M tons ? 40M tons (vehicles)
- storage 4.4 MJ/L (10K psi gas) ? 9.72 MJ/L
- fuel cells 3000/kW ? 35/kW (gasoline engine)
- Enormous RD efforts will be required
- Simple improvements of todays technologies
- will not meet requirements
- Technical barriers can be overcome only with high
risk/high payoff basic research - Here nanostructures are expected to play an
important role - Research is highly interdisciplinary, requiring
chemistry, materials science, physics, biology,
engineering, nanoscience, computational science - Basic and applied research should couple
seamlessly
http//www.sc.doe.gov/bes/ hydrogen.pdf
61
Acknowledgements
Collaborators Nanotubes Dr. Gene
Dresselhaus (MIT) Georgii G. Samsonidze (MIT) S.
Grace Chou (MIT) Dr. Antonio G. Souza Filho
(Brazil) Dr. Ado Jorio (Brazil) Prof. Riichiro
Saito (Japan) Dr. Stephen B. Cronin (Harvard)
Funding NSF DuPont Intel
Nanowires
Dr. Yu-Ming Lin (MIT) Oded Rabin (MIT) Dr.
Marcie Black (MIT) Prof. Gang Chen (MIT) Dr. J.
Heremans (Delphi Corp.)
NASA
Recommended
CrystalGraphics Presentations


