
PowerPoint study - PowerPoint PPT Presentation
Title:
PowerPoint study
Description:
For my studies – PowerPoint PPT presentation
Number of Views:0
Title: PowerPoint study
1
BCOBM 121. PROJECT MANAGEMENT.
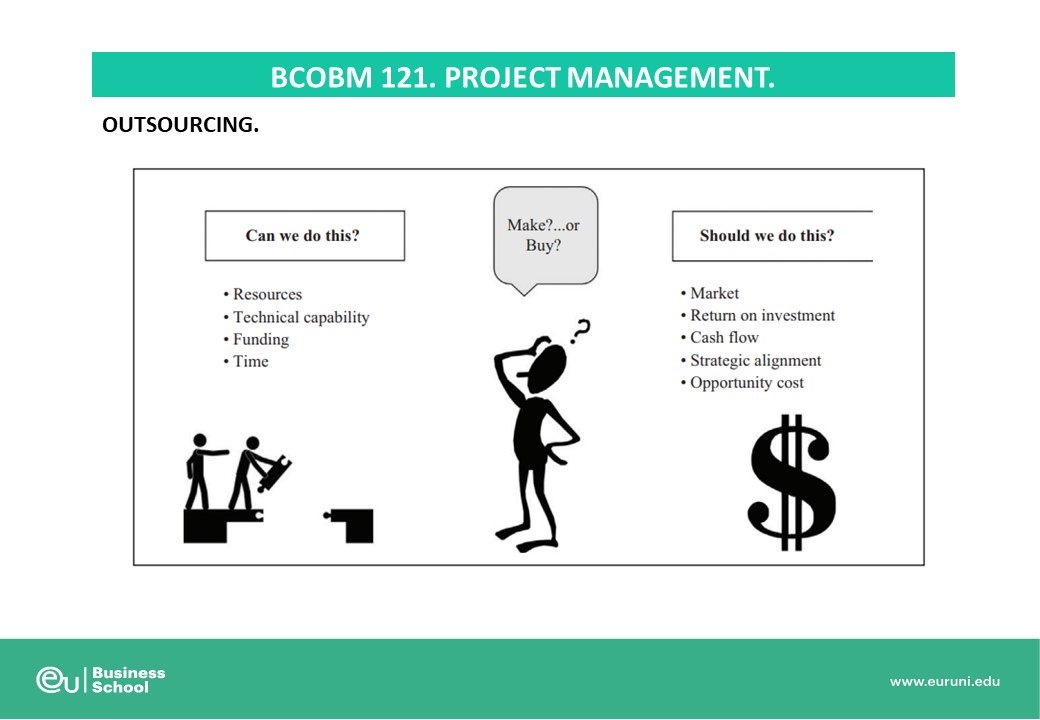
OUTSOURCING.
2
BCOBM 121. PROJECT MANAGEMENT.
3
BCOBM 121. PROJECT MANAGEMENT.
4
BCOBM 121. PROJECT MANAGEMENT.
5
BCOBM 121. PROJECT MANAGEMENT.
6
BCOBM 121. PROJECT MANAGEMENT.
7
BCOBM 121. PROJECT MANAGEMENT.
8
THE TEN KNOWLEDGE AREAS OF PM (PMBOK)
9
BCOBM 121. PROJECT MANAGEMENT.
CONTROLLING DOCUMENTS.
Controlling documented information is required to
make sure that correct and up-to-date information
is available where and when it's needed. To
achieve this, there are a number of things to
think about Identification. How is documented
information identified? Do you specify titles,
numbering, dates? Can you refer to a specific
document without any confusion? If there were two
forms with very similar titles, then a form
number will make it easy to pick the right
one. Format. Which is the best format for this
information? Should it be stored as an electronic
document? Distributed on paper? Is the content
better presented as a video instead of a written
document? Is the information controlled through
the software used? Review and approval. When a
new document is found, or is created, how is it
approved for release? Who reviews a document to
make sure it is correct and suitable for use? How
will I know a document has been approved?
10
BCOBM 121. PROJECT MANAGEMENT.
Distribution, access, retrieval and use. How will
be provided the access to released documents
everywhere they are needed? Can everyone to get
them from the server? What about workers on the
shop floor, out on site, on the road? Will they
need hard copies, or some other offline
distribution method? How do you handle
confidential information? Storage and
preservation. How to protect the documented
information from unauthorised changes, or loss?
Can anyone edit and delete the files? Do you have
master copies stored safely? What about backups?
Control of changes. When changes are made, how
are them identified? How will people know if they
do, or don't, have the updated information? How
will I know what has changed between this version
and the latest release? How do I know what
version my copy is, or the version of this paper
copy I found?
11
BCOBM 121. PROJECT MANAGEMENT.
Retention and disposition. How is prevented the
use of obsolete documents? How will you make sure
that ONLY current documents are in use? Are there
hard copies to update? How do you keep track of
them? Will you make end users responsible for
checking the status of their hard copies before
each use? Will you delete/destroy old documents?
How will you identify/segregate/archive obsolete
documents you might want to keep?
External documents. How do you find and control
documents from external sources? - e.g. relevant
standards, legislation, supplier product
specifications. 'Control' meaning all of the
previous questions on approval, review, updates,
access, etc.
12
BCOBM 121. PROJECT MANAGEMENT.
SETTING A DOCUMENTARY CONTROL PROCEDURE.
1 - Put some control information on the document
itself - on every controlled document. Some
information will go at the front of the document,
and some needs to be on every page (usually in
the footer), Here's an example of a basic header
13
BCOBM 121. PROJECT MANAGEMENT.
This header shows what document I'm looking at
('MSP-04 Control of Documents'), and answers the
questions on how to tell this document has been
approved ('Released'), and the version ('3 March
2016'), who is responsible for approving it
('Office Manager'), and where to find it
('Quality Systems Toolbox'). A footer example
Why on every page? Number, name of the
document - so you know what it is and can find
the master copy, even if the first page is
missing. Some people use the location of the
master copy instead. e.g., a file path
"G\Documents\ControlDocuments.doc", or a URL
https//www.qualitysystems.com/ Revision date or
number - so you can easily check to see whether
the copy you have is the latest, even if the
first page is missing, or your different (paper)
versions get mixed up. Page numbering "page x of
y" - so it is easy to see if you are missing a
page.
14
BCOBM 121. PROJECT MANAGEMENT.
2 - Nominate a single place to keep master copies
and a register of documents. This is where end
users will go to check whether the version they
have is the latest version. It may also be the
place where they access the documents they need.
In the past, this would have been paper master
copies kept in the office, or on the document
controller's hard drive. Access to the documents
was through a 'gate keeper' person. More
commonly now the document repository is a network
drive, or online and access is granted through
user accounts, permissions and passwords. In some
cases the practicalities of accessing the
computer may be difficult/impossible for some
locations or some personnel and hard copies must
be distributed. Keep track of where they go, so
that you can replace them with any updated
versions. The documents register is simply a
list of all the controlled documents. You'll need
one to keep track of all your management system
documents and it helps you to know what needs to
be reviewed. Ideally the register will include
the title, revision info (date or number or
both), status (draft, released, etc.) and who is
responsible for the document (a name and/or a job
title).
15
BCOBM 121. PROJECT MANAGEMENT.
3 - Work out how to manage changes. Changes In
file-server and paper-based management systems,
changes are usually tracked in a table on the
document itself. The change table needs to
include the revision number/date along with
comments on what changes were made. Approval Ap
proval by the process owner use to be the best
option.
Review Documents need to be reviwed regularly to
make sure they are up-to-date, suitable and still
reflect your practices. How often will depend on
the process.
16
BCOBM 121. PROJECT MANAGEMENT.
Superseded versions Obsolete documents that must
be kept for reference purposes should be clearly
marked to make it obvious they are no longer
current. It's best not to store them in the same
place as current information. KEEP ALWAYS AN
OBSOLETE FOLDER FOR THOSE EXTERNAL DOCUMENTS
BELONGING TO PROCESS NEGOTIATIONS!
IDENTIFICATION
DOCUMENTS RELATED TO INTERNAL PROCESSES OF THE COMPANY (Procedures, technical instructions, formats) According to the standard method of the Company
CONTRACTS, PLANS, CHARTERS Related to the Project number/id
CONTROL SHEETS (Quality, Cost, Ending of actions,) Related to the Project number/id and to the Action/Step
17
BCOBM 121. PROJECT MANAGEMENT.
COSTS AND RISKS.
Traditional deterministic cost estimating
produces specific values for each of the cost
elements of the project. Traditionally these
estimates are then summed to determine how much
the project will cost, without contingency. A
contingency reserve is then added using the
methods of the estimator. This process is good as
far as it goes. The problem with this approach is
that it does not go far enough in estimating how
much the project will cost.
Most estimators do not conduct cost risk
analyses, instead they use standard contingency.
Cost risk analysis is designed to determine the
most appropriate level of contingency reserve
given the level of risk in the project and the
degree of cost certainty the stakeholders want to
provide. Also, cost risk analysis can identify
the main risks to cost so that risk mitigation
actions can be considered and planned. The
appropriate contingency reserve usually differs
from the reserve included in the traditional cost
estimating process, which is often a
rule-of-thumb figure.
18
BCOBM 121. PROJECT MANAGEMENT.
- Estimations of the Cost Risk. The 3-point
Representation. - The traditional way to represent cost risk is to
place uncertainty on the estimate for the cost of
each project element. This means that each cost
line item is taken as possibly uncertain and the
cost estimate is better thought of as a
probability distribution rather than a concrete
estimate. If some line items are certain, they
will no included in this kind of calculation. - There may appear three possible estimations
- The optimistic (the lowest one).
- The pessimistic (the highest). For this estimate
we have include the impact of project threat-type
risks. - The most likely. It doesnt have to coincide
with the early estimation. - The best way to represent the cost of any element
is with a probability distribution.
19
BCOBM 121. PROJECT MANAGEMENT.
The triangular distribution can be asymmetrical,
a very valuable characteristic since most cost
risk phenomena are asymmetrical. That means if
there are more reasons for the cost to be higher
than the most likely than to be lower, the
triangular distribution accommodates asymmetry by
putting more probability (area under the curve)
to the right of the most likely value than to its
left.
20
BCOBM 121. PROJECT MANAGEMENT.
There are other probability distributions that
are commonly used. The Beta distribution. It
is not specified by a 3-point estimate. Usually
the Beta is described with minimum and maximum
values and two shape parameters that describe
where the most probable point will be. But
collecting the shape parameter data is not
evident. Recently several software developers
have developed a BetaPERT distribution that has
the shape of a Beta distribution but can be
described by the 3-point estimate. To do this,
the software has a built-in constraint around the
shape parameters. The benefit of the BetaPERT
is that it looks more graceful and may have a
long tail in the pessimistic direction,
reflecting our common sense that there are some
risks that make the costs large, even if those
risks are not very likely. Triangular
distribution has more probability out toward the
pessimistic tail of the distribution than the
comparable BetaPERT does.
21
BCOBM 121. PROJECT MANAGEMENT.
50-100-200
Often professional project risk analysts will
choose the triangular distribution since It
is perfectly described by the 3-point estimates.
The fat tail toward the pessimistic estimate
may be minimized by the interviewed.
22
BCOBM 121. PROJECT MANAGEMENT.
There are other probability distributions that
may be used The uniform distribution, used
when there is not much information about the
risks and a guess can be made only about the best
and worst case. The normal or Gaussian
distribution, often called the bell curve. This
distribution must be symmetrical around a value
that is at once the mean, median and mode.
50-100-200
23
BCOBM 121. PROJECT MANAGEMENT.
50-100-200
Triangular distribution is often preferred to be
used in simulations. Experience tells us that it
is more important to get the extreme ranges and
most likely values correct than to spend a lot of
effort discussing the precise type of probability
distribution to use, although the Monte Carlo
simulation packages have multiple distributions
available.
24
BCOBM 121. PROJECT MANAGEMENT.
RISK SIMULATION.
After the initial qualitative analysis is
conducted, further detailed analysis using
historical data or probabilistic simulation may
be employed. One method commonly available in
many current Project Management software packages
is Monte Carlo analysis. In this type of
probabilistic analysis, duration and cost values
are chosen at random from a range of inputs
(drawn from three-point estimates) to the project
schedule. After several thousand runs, the
analysis arrives at a probability duration of
schedule completion dates as well as costs. The
thousands of runs could be considered a long-run
simulation of the project. This type of
quantitative risk analysis informs Project
Managers of the possible range of project
outcomes calculated to be likely given the cost
and schedule input data created from the risk
brainstorming process.
25
BCOBM 121. PROJECT MANAGEMENT.
Finding the Total Project Cost Uncertainty. The
cost of each project element in the project cost
estimate is uncertain and we should use
probability distributions to represent that
uncertainty. It seems logical to add up the
project elements deterministic cost estimates to
determine the overall project cost. However this
is a dangerous practice and can lead to
unwarranted confidence in a number that is
probably not even the most likely total project
cost, for two reasons The cost of any
project element may not be the value found in the
cost estimate. Estimation may be old, inaccurate,
a guess or even biased, usually toward the low
side. Even if each project element estimate
is non-biased, the sum of the most likely
estimates is not a reliable estimate and is
usually not the mean, most likely or median value
of the probability distribution of total project
costs.
26
BCOBM 121. PROJECT MANAGEMENT.
It is required to combine the probability
distributions of the individual project elements
to derive information about the total project
cost. The analytical way to do it is called the
Method of Moments (MOM). The most commonly used
way that has more flexibility and power and gives
the correct answer in most circumstances is Monte
Carlo simulation.
The Method of Moments (MOM). It is sometimes
called PERTCost, since it uses the statistical
principles that support PERT. MOM is often
applicable to the analysis of cost risk where the
model used is simply a spreadsheet summation of
individual values (costs of project elements)
without any multiplication or other mathematical
manipulation. The overall total project cost
probability distribution can be characterized by
its moments, (hence the Method of Moments)
the first two of which are the mean and the
standard deviation. Lets see how it works
across a simple example of a construction project
starting with design, engineering and procurement
of equipment and bulk materials, leading to the
actual construction and commissioning of the
system.
27
BCOBM 121. PROJECT MANAGEMENT.
Here is the initial cost estimate without
contingency in the estimates of a hypothetical
construction project. The question that
management often raises is What do we think of
the estimate of 1.64 billion? Will it be
adequate to construct the scope of work we intend
for this project?
The answer to this question should be We wont
know until we analyze the project risks. So let
us assume that we have the go-ahead to conduct
cost interviews to get 3-point estimates for each
of the six project elements.
28
BCOBM 121. PROJECT MANAGEMENT.
The goal of the MOM is to derive information
about the probability distribution of the total
project cost from the distributions of the
individual line items. The mean of the total
project cost probability distribution anchors
that distribution along the X-axis. The
standard deviation of the total project cost
probability distribution tells us whether the
distribution is tall and skinny or short and
fat.
29
BCOBM 121. PROJECT MANAGEMENT.
- Now we should find the mean and the cost for the
whole project. - Mean total project cost Sum of the project
element cost distribution means
- Remember that the means differ from the most
likely value! - How do we compute the standard deviation of the
total project cost distribution from the data
given to us as 3-point estimates for each project
element line item? - The standard deviation of the total project cost
distribution is the square root of the sum of the
variances (not the sum of the standard
deviations) of each uncertain project element
line items cost - Standard Deviation of total project cost
Square root (sum of the individual project
element line items variances) - According to the chosen models, Mean and Variance
will be calculated so
30
BCOBM 121. PROJECT MANAGEMENT.
Using the triangular distribution
31
BCOBM 121. PROJECT MANAGEMENT.
The mean cost is 1,857 million whereas the sum
of the most likely estimates is 1,640 million.
The standard deviation is 96.4 million so we now
have the first two moments of the total project
cost distribution. However, which distribution
shape should we assume for the total project
cost? In statistics it is said that if you have
enough uncertain variables added together the
shape of the resulting distribution is close to
the Gaussian. Suposing that six elements is
enough, the shape of the distribution with a
mean value of 1,875 and a standard deviation of
96.4 is best captured by the normal
distribution. Take a look now to the cost with a
80 of certainity.
32
BCOBM 121. PROJECT MANAGEMENT.
If we adopt a budget that covers 80 percent
rather than just 50 percent of the risks we know
about, then we are in a better position to handle
the risks we do not now know about, the
unknown-unknowns that will be uncovered at a
later stage of project execution.
33
BCOBM 121. PROJECT MANAGEMENT.
Monte Carlo simulation. Introduction Project
cost estimates provide single-point values. The
estimator then sums those elements to calculate a
number that is represented to the customer as the
total cost of the project without contingency
reserve, which can be added later. This number is
used in promoting the project and calculating
project economics.
Monte Carlo simulation, using a specialized
software, gives a good estimation. As a way to
sum up probability distributions, the MOM has its
limitations, including
It can only be used on simple summation-type
models. The MOM assumes a type of probability
distribution for the total project cost estimate.
We assumed that the total project cost
distribution was normal, but we dont know it.
Still, we used the normal distribution
assumption, knowing it was not exactly correct.
34
BCOBM 121. PROJECT MANAGEMENT.
Monte Carlo simulation starts with the cost or
schedule model of the project, so it is based in
project management discipline, methodology and
essential documents. Monte Carlo simulation also
recognizes the uncertainty that we have put into
the model for those elements costs that we do
not know with clarity. The cost model with the
line items are
Monte Carlo recognizes the distributions that
we have put into the cost model. It knows the
shape of those distributions and the parameters
(3-point estimates) because we have specified
those.
35
BCOBM 121. PROJECT MANAGEMENT.
Monte Carlo runs or iterates the project
multiple times, creating often thousands of
projects that could represent our own. For each
iteration Monte Carlo selects at random a cost
for each project element and calculates the total
cost of the project for that iteration by summing
those elements. Each of these iterations
represents a possible project since it creates a
different possible project every time by taking
its costs from the cost probability distributions
specified by the analyst. The way Monte Carlo
selects the costs at random for each cost element
and for each iteration is to use the cumulative
distribution implied by the 3-point estimate and
the distribution chosen (triangular in this case)
for each of the uncertain project element input
distributions. For each iteration and for each
project element the simulation software selects
at random a number from 0 to 1.0 using the
computers random number generator. This value is
placed along the Y-axis of the project elements
cumulative distribution. This random number is
translated into a specific cost by the cumulative
distribution derived from the 3-point estimate of
that project element, and that cost value is used
for that element in that iteration.
36
BCOBM 121. PROJECT MANAGEMENT.
When doing iterations, sometimes one of the
project elements will have an Optimistic value,
sometimes will be Pessimistic. The results for 5
different iterations would result like this
37
BCOBM 121. PROJECT MANAGEMENT.
The more iterations are performed the more
accuracy is produced, but with diminishing
returns. Usually analysts want to perform
5,00010,000 iterations for accuracy,
particularly for the final report runs, but in
some cases the results from 5,000 iterations are
not materially different from those produced by
2,000 iterations.
38
BCOBM 121. PROJECT MANAGEMENT.
The estimate of 1,640 is not the most likely
total cost. The most likely is about 1,857
billion which is also the mean of the
distribution. The range of the distribution
falls between 1.566 billion and over 2.270
billion, a difference of about 700
The four columns on the far left-hand side of
the histogram are shaded, indicating the
probability that the project will come in at or
under the total project estimate (without
contingency) of 1.640 billion
39
BCOBM 121. PROJECT MANAGEMENT.
A Project Cost Contingency Reserve should have to
be created!
40
BCOBM 121. PROJECT MANAGEMENT.
41
BCOBM 121. PROJECT MANAGEMENT.
Sensitivity Analysis Most Important Risk
Elements.
One analytical tool that helps understand the
relative importance of the different risks is the
sensitivity analysis. This analysis correlates
the input uncertainties, in this case, two
popular simulation software packages that add in
to Microsoft Excel are Crystal Ball from Oracle
and _at_RISK from Palisade Corporation. The
sensitivity analysis allows prioritizing the
risky elements by presenting the uncertain
project elements in order of their correlation to
the total cost. The basis of the usefulness of
this tool is that While correlation between
two uncertain variables does not necessarily
imply causality. The closer the variation in
the two types of uncertain variables is, the more
closely the project element line item input
drives or determines the total project cost
output. If you want to reduce the uncertainty
of the overall total project cost, it would be
useful to focus your efforts on those uncertain
project elements that cause the project cost to
be uncertain.
42
BCOBM 121. PROJECT MANAGEMENT.
Examining this chart, it seems that uncertainty
in the cost of construction and in the cost of
procured materials are the most important in
determining uncertainty in total project costs.
Controlling the uncertainty in the project
components at the top of the sensitivity chart
will be most effective in controlling total
project costs. The prioritization of project
elements does not mean that the mitigation of the
risks on construction and procured materials will
be easy or even feasible. The Project Manager
will also want to consider the ease and cost of
risk mitigation compared to the effectiveness in
reducing the risk in total project cost before
enacting risk mitigation
43
BCOBM 121. PROJECT MANAGEMENT.
Project Management Scheduling using Excel and
Monte-Carlo Simulation a Simple Example - YouTube
Monte Carlo simulation of cost risk - YouTube
Recommended
CrystalGraphics Presentations


