
Problem 6: Route 146 Arterial Study - PowerPoint PPT Presentation
Title:
Problem 6: Route 146 Arterial Study
Description:
The geometry of the Fire Road ... Maxwell Drive Effects of ... Route 146 Arterial Study PowerPoint Presentation PowerPoint Presentation ... – PowerPoint PPT presentation
Number of Views:66
Avg rating:3.0/5.0
Title: Problem 6: Route 146 Arterial Study
1
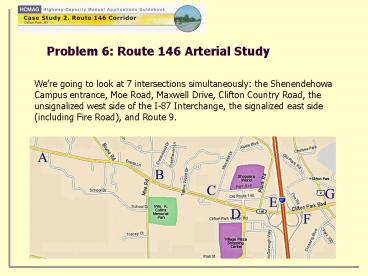
Problem 6 Route 146 Arterial Study
Were going to look at 7 intersections
simultaneously the Shenendehowa Campus entrance,
Moe Road, Maxwell Drive, Clifton Country Road,
the unsignalized west side of the I-87
Interchange, the signalized east side (including
Fire Road), and Route 9.
2
- We will focus on the PM peak hour. (PM with-site
condition) - The intersection counts and signal timings weve
obtained will be used as basic inputs to create a
TRANSYT7-F (Version 9.5) simulation dataset. - We will exercise TRANSYT7-F in simulation mode to
see how it thinks the network is performing. - Finally, we will use it to optimize the
performance of the network as a coordinated
system.
3
(No Transcript)
4
What are the typical data requirements for this
type of analysis?
- Saturation flow rates for each lane group
- Volumes for each lane group
- Signal timing plans (consistent with the HCM
input datasets) - Distances between the intersections
- Link-to-link movement patterns
- Minimum phase lengths
- Opposing links for the permitted lefts and the
right turns that can move when there is no
competing traffic, as at Clifton Country Road
northbound
5
HCM from the HCM analysis
Timings From
T7F1 hand-generated input to TRANSYT7-F to get
acceptable v/c ratios for all of the lane groups
T7F2 developed by TRANSYT-7F when it
optimized coordinated operation across the
network
6
At what locations were substantial timing changes
necessary to improve the v/c ratio between the
HCM and T7F1?
Maxwell Drive and only for phases 1 and 3, all
the others were very closely aligned!!!
Other observations?
7
What have we learned?
- The HCM analyses prepared us quite well for the
network analysis. - TRANSYT-7F was able to improve the performance of
the system (delay-wise) by only about 8, when it
optimized the signal timings. - The way the HCM treats these intersections is
very similar to the way they are treated in
TRANSYT-7F. The two analytical methods expect
very similar inputs, treat the problem in similar
ways, and produce similar outputs. - The one major difference between the HCM and
models like TRANSYT-7F is that the capacities of
the saturation flow rates are derived by the HCM,
whereas they are inputs in the case of
TRANSYT-7F. - Oftentimes, it helps to do the HCM analyses first
and get credible saturation flow rates for the
various lane groups before starting a TRANSYT-7F
analysis.