
Environmental Indicators Recycled Materials - PowerPoint PPT Presentation
1 / 14
Title:
Environmental Indicators Recycled Materials
Description:
Recycling rates continue to increase with a 4% increase over last year. Increased education regarding recycling and sustainable purchasing have led to a ... – PowerPoint PPT presentation
Number of Views:105
Avg rating:3.0/5.0
Title: Environmental Indicators Recycled Materials
1
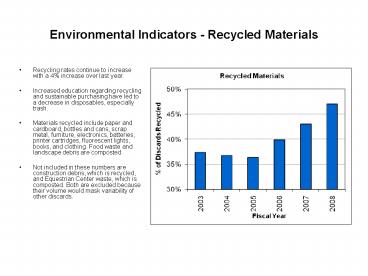
Environmental Indicators - Recycled Materials
- Recycling rates continue to increase with a 4
increase over last year. - Increased education regarding recycling and
sustainable purchasing have led to a decrease in
disposables, especially trash. - Materials recycled include paper and cardboard,
bottles and cans, scrap metal, furniture,
electronics, batteries, printer cartridges,
fluorescent lights, books, and clothing. Food
waste and landscape debris are composted. - Not included in these numbers are construction
debris, which is recycled, and Equestrian Center
waste, which is composted. Both are excluded
because their volume would mask variability of
other discards.
2
How were our routine discards collected in
FY2007-08 at Mount Holyoke?
- Routine Trash collected and sent to landfill.
- Paper Cardboard collected for Recycling
- Bottles cans collected for Recycling
- Food Waste collected for Composting
- All by weight
3
Tons Routine Trash at Mount HolyokeFY07-08 vs
annual average of previous 5 fiscal years
4
Tons Paper Cardboard Recyclingat Mount Holyoke
College FY07-08 vs annual average of previous 5
fiscal years
5
Tons Bottle Can Recyclingat Mount Holyoke
College FY07-08 vs annual average of previous 5
fiscal years
6
Basic Recyclables at Mount Holyokeas a of
Total Basic Discards FY07-08 vs annual average
of previous 5 fiscal years
- Total basic discards Sum of both basic
recyclables (paper, cardboard, and bottles
cans), and routine trash (the routine trash
from bins on campus not including construction
waste or other bulky trash e.g. mattresses and
broken furniture). - tons basic recycling/(tons basic recycling
tons routine trash)
7
Notes
- There was a very aggressive waste reduction
campaign on campus this spring as part of Focus
the Campus Efforts. - Decreases in paper recycling tonnage and routine
trash tonnage reflect the successful
implementation of aggressive waste reduction
efforts targeted at reducing paper and printing
wastes. - Had the decrease in paper been accompanied by an
increase in routine trash, it would likely have
reflected an issue with the recycling program
that was causing more paper to be discarded as
trash. - However, a decrease in both paper recycling and
routine trash indicates an overall decrease in
generation, a combination of both a successful
waste reduction campaign and an overall decreased
economy. - Some of the decrease in paper is also a result of
increased shredding of confidential paper, for
which we do not get accurate tonnages. - The tiny dip (less than 1/3 of a percent) in
basic recycling percentage reflects
disproportionate success of waste reduction
efforts targeted at reducing paper printing
waste (which removed materials from the recycling
stream) as opposed to those aimed at reducing
food-related packaging and other wastes, such as
tissues and paper towels (which removed material
from the trash stream).
8
Average monthly tons food-waste compost picked up
by periodFrom Mount Holyoke College FY07-08
Food waste compost includes uneaten post-consumer
food waste, pre-consumer food prep scraps,
biodegradable foodserviceware, and some cardboard.
9
2008 Residential Trash Sortfor Mount Holyoke
College
10
Basic Discards Recycledby Fiscal Year
- Basic discards tons basic recyclables/(tons
basic recyclables tons routine trash) - Tons basic recyclables tons paper, cardboard,
and bottles cans - Routine trash is trash from dumpsters around
campus. It does not include bulky waste
roll-offs or waste from construction renovation
projects.
11
Per capita total basic discardsby Fiscal Year
- Per capita is based on total lbs basic discards
for entire campus divided by the number of
students - Basic Discards tons basic recyclables tons
routine trash - Tons basic recyclables tons paper, cardboard,
and bottles cans - Routine trash is trash from dumpsters around
campus. It does not include bulky waste
roll-offs or waste from construction renovation
projects. - In addition to waste reduction efforts, two
recycling changes may help to explain the drop in
per capita discards at Hampshire, Mount Holyoke,
and Smith. One is more material being diverted
into food waste which is not included in this
analysis. At Hampshire and Mount Holyoke, the
other is more paper being diverted to
confidential shedding for which weights are not
available.
12
Lbs paper cardboard recycled per studentFY07-08
- Per capita data includes material from entire
campus divided by number of students (as the
common population denominator.
13
Lbs bottles cans recycled per studentFY07-08
- Per capita data includes material from entire
campus divided by number of students (as the
common population denominator.
14
Lbs routine trash landfilled per studentFY07-08
- Routine trash is trash from dumpsters around
campus and does not include bulky waste, waste
from construction demolition projects, or waste
from off-campus family housing units. - Per capita data includes material from entire
campus divided by number of students (as the
common population denominator.
Recommended
CrystalGraphics Presentations


