
Oslo, PowerPoint PPT Presentation
Title: Oslo,
1
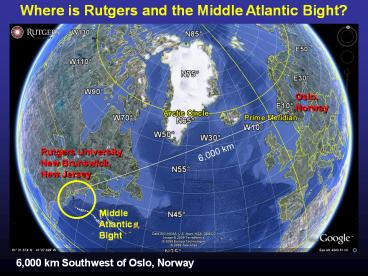
Where is Rutgers and the Middle Atlantic Bight?
Oslo, Norway
Rutgers University, New Brunswick, New Jersey
6,000 km
Middle Atlantic Bight
6,000 km Southwest of Oslo, Norway
2
Cape Cod
New Jersey
Building a Regional Ocean Observatory for the
Middle Atlantic Bight Our View from the COOLroom
Scott Glenn, Oscar Schofield, Robert Chant,
Josh Kohut, John Manderson, Janice McDonnell,
Cisco Werner, John Wilkin Plus Research Staff
Students
Cape Hatteras
3
Cape Cod
New Jersey
- Industry Partners
- SeaSpace
- CODAR Ocean Sensors
- Teledyne Webb Research
- Teledyne RD Instruments
- Satlantic
- Wetsat
- University Partners
- Government Partners
Building a Regional Ocean Observatory for the
Middle Atlantic Bight Our View from the COOLroom
Scott Glenn, Oscar Schofield, Robert Chant,
Josh Kohut, John Manderson, Janice McDonnell,
Cisco Werner, John Wilkin Plus Research Staff
Students
Cape Hatteras
4
The Mid-Atlantic Bight Ecosystem
- The Mid-Atlantic Bight is getting
- Fresher Warmer
- Experiences Some of the Largest
- Temperature Differences in the World
- Summer to Winter
- Top to Bottom
- Some of the Most Migratory
- Fish Species have Evolved
5
The Urbanized MAB Ecosystem - Developed Countries
Middle Atlantic Bight is the most Urbanized Coast
in the U.S.
Global Vessel Traffic
6
Rutgers University - Coastal Ocean Observation
Lab Operations, Data Fusion Training Center
3-D Nowcasts Forecasts
L-Band X-Band Satellite Receivers
CODAR Network
Glider Fleet
7
International Constellation of Satellites Since
1992
L-Band (installed 1992)
X-Band (installed 2003)
Regional
IRS-P4 OCM Chlorophyll India
Local
MODIS United States
Global
FY1-D ch7ch9 China
8
B)
C)
- CODAR
- HF Radar
- Network
- 1998-
- 2009
E)
D)
F)
G)
H)
I)
J)
9
Autonomous Underwater Gliders
Since 1999
10
WRF Weather Forecasting Daily Cycles
11
Coupled Regional Ocean Models (ROMS) for Research
and Operations (Physics, Bio-optics, Ecology,
Sediment Transport)
12
Rutgers-led Process Studies
ONR MURI REA 2006-2010
NSF LaTTE 2004-2006
NSF MSF 2006-2007
ONR SW06 2005-2006
ONR CPSE HyCODE 1998-2001
Observatory-Enabled Collaborative Research
Campaigns in the Mid-Atlantic Bight
13
Upwelling Center Observed by Satellite SST
Shipboard CTD 1993
14
Atmosphere/Ocean Ensemble Forecast Models
3-D visualization
Operational Low-Res COAMPS Atmospheric Model
Experimental High-Res RAMS Atmospheric Model
Air-Sea Interaction Model
Hindcast Models
EcoSim Bio-Optical Model
ROMS Ocean Model (KPP and MY 2.5 Turbulent
Closure)
Forecast Briefing
Bottom Boundary Layer Model
15
Shore-based Communication Center Enabling
Adaptive Sampling 13 Ships/Boats, 4 Aircraft 2
AUVs
16
Adaptive Sampling of Resolved Scales- Shipboard
AUV surveys
North Velocity
17
LEO Collaborations Partnerships
18
LaTTE Principal Investigators Physics Bob
Chant (Rutgers) Bernie Gardner (U. Mass) Scott
Glenn (Rutgers) Bob Houghton (Lamont) John Wilkin
(Rutgers) Chemistry John Reinfelder
(Rutgers) Bob Chen (U. Mass) Biology Paul
Bissett (FERI) Tom Frazer (U. Florida) Mark
Moline (Cal-Poly) Oscar Schofield (Rutgers) Meng
Zhou (U. Mass) Plus Many Others
An Interdisciplinary Process Study of the
Hudson River Plume in a Sustained Coastal
Observatory
Dye Release Studies May 2004 Pilot 1/3,
2/3 Split April 2005 High Flow 2
Injections May 2006 Follow-up 1 Injection
Coastal Observatory Sponsors
19
Specific LaTTE Goals and Objectives
To quantify mixing and the rates that biological
and chemical processes transform material in
a Buoyant Urban Coastal Plume
- Biological production rates
- and community composition
- Zooplankton community
- response
- Bioavailability and bio-
- accumulation of metals
- CDOM photobleaching rates
New York City
Downwelling Wind
Upwelling Wind
Link these rates to wind forced changes in the
structure of the plume.
Geyer and Fong
20
Modeling Tools for the LaTTE Process Study
Atmospheric Model WRF
Ocean Physics ROMS
Biogeochemical NENA, EcoSim
Bowers, Dunk
Choi, Wilkin
Fennel, Bissett
21
Observational Tools for the LaTTE Process Study
Mooring Arrays Physics Coastal Current
R/V Cape Hatteras Physics Chemistry Undulating
Towbody
R/V Connecticut or Oceanus Biology Optics Water
Sampling
22
Ship-to-Shore Communications Guide Shipboard
Sampling
- AirNet Communications Wireless Broadband (1.5
Mbps, coverage 7 miles offshore from Sandy Hook) - Verizon National Access (100 kbps, coverage up
to 20 miles off Long Island, less for New
Jersey) - Freewave Radio Modems (80 kbps, coverage for a
18 mile radius centered at Sea Bright Fire
Department) - Verizon Quick2Net (14.4 kbps, coverage up to 20
miles off both New Jersey and Long Island) - Iridium Satellite (2,400 bps, global coverage,
data and voice)
23
Observatory View of the Hudson River Plume
View of the Ocean from the COOLroom
24
Nested Atmospheric Forecast Models NCEP NAM
RU WRF
AM
PM
22 km North American Model (NAM)
6 km Weather Research Forecast (WRF)
25
The Nearshore Recirculation An Incubator for
Phytoplankton
Drifters Recirculate
Observatory Finds The Frazer Eddy!
Hudson River
Oxygen Drops
Large Phytoplankton Dominate
26
Freshwater Plume moves Cross-Shelf, down the
Hudson Shelf Valley
Satellite SST
27
LaTTE 2005 -- After Luring the Cape Hatteras
Offshore.
Shipboard Salinity Section Across the NJ Coastal
Current and the HSV Highway
The survey began on the Highway. We were near
the glider when it surfaced. We saw currents
ripping southward in a 10 m thick layer of
freshwater along the highway -- perhaps the most
significant freshwater transport we saw all
week. Perhaps the most perplexing to me
is the Highway and why there has been a lack of
a strong coastally trapped flow this week.
--- Bob Chant aboard the Cape Hatteras, April
21, 2005
28
Collaborative Campaign Science in the Middle
Atlantic Bight The Shallow Water 2006 Joint
Experiment (SW06)
gt12 Satellites
48 Senior PIs PMs
7 Ships
3 Ground- stations
10 Gliders
1 Aircraft
62 Moorings
29
Collaborative Campaign Science in the Middle
Atlantic Bight The Shallow Water 2006 Joint
Experiment (SW06)
gt12 Satellites
HiSeasNet
48 Senior PIs PMs
7 Ships
Communication
3 Ground- stations
10 Gliders
1 Aircraft
62 Moorings
30
ROMS LATTE outer boundary
ROMS SW06 outer boundary
Harvard Box (100 km)
Existing 6 km WRF Atmospheric Forecast Domain .
. . . . . . . . . . . . . . . . . . . Proposed
Extension
SW06 Atmospheric and Ocean Forecast Model Domains
31
Shallow Water 2006 Joint Experiment
Year 1 Objectives 1) Prepare and deploy a fleet
of gliders to occupy a series of closely spaced
repeat transects across the shelf-slope front
within and around the SW06 mooring array,
maintaining a continuous presence for the full
duration of the joint experiment. 2) Distribute
the glider CTD datasets in near real-time to the
ocean modeling community for assimilation by
forecast models. 3) Use the full resources of
the New Jersey Shelf Coastal Observatory to
support real-time shipboard operations in the
SW06 region.
Goal 2 Waves x 6 Gliders/Wave x 30
Days/Glider 360 Glider Days
32
SW06 Glider Statistics (as of 10/02/2006) Deploym
ents 17 Km Flown 6,683 CTD Profiles
51,933 Calendar Days 94 Glider Days 360
Glider Costs Support Vessels - 41,404.50 (lt
4 UNOLS Ship Days) Batteries - 17,000 (lt2
UNOLS Ship Days) Iridium Communications
65,000 Total Costs 123,404.50 5 People for
3 months - none full time 1 person
year Equivalent Ship Cost Estimate 360 days x
10,000/day 3,600,000
SW06 Glider Tracks
33
Sustained Observatory Operations from Multiple
Locations
MBARI
McDonalds
My Living Room Glider Recovery in Hawaii
34
Facilitated by a fixed Operations Center, the
Observatory can be sustained and accessed from
anywhere!
Summer 2006 REAL-TIME DATA COLLECTED, SYNTHESIZED
BY LEAD SCIENTIST AND THEN DISTRIBUTED TO THE
COMMUNITY BY 10 AM Morning Reports 78 Storm
Alerts 10 Locations 5 Wayport WiFi 94 Hrs
35
Daily Reports available at Sea by HighSeasNet
WHOI ExView
36
This leads to unique science culture, where
several experiments, training and education
efforts are conducted at the same time.
MORNING ON EAST COAST OF UNITED STATES
Coordinated Swarms of Gliders Sweep Across the
Shelf Slope Front 3-D Evolution of Slope Water
Salinity Intrusions is Captured
Salinity
Temperature
Internal Wave Packets are Identified for Ship
Board Studies
37
Cross-shore Transport at the Shelf Break
3-D Structure of Salinity Intrusions Observed 4
Types of Intrusions Identified
38
Seasonal Conditionally-Averaged Mean Surface
Current (2002 - 2007)
Spring
Winter
Cross-Shelf
Along-Shelf
Fall
Summer
39
Tropical Storm Ernesto, Labor Day Weekend, 2006
5 am Friday Morning Where do we send the ships?
Observed Track is Yellow RU-WRF is Orange
40
(No Transcript)
41
U.S. Integrated Ocean Observing System
- NOAA-Led IOOS Components
- International Component
- National Component
- a) 17 Federal Agencies
- b) 11 Regional Associations
- IOOS Goal - Provide continuous data required by
scientists, managers, businesses, governments,
and the public to support research and inform
decision-making. - Improved Ecosystem and Climate Understanding
- Sustained Living Marine Resources
- Improved Public Health and Safety
- Reduced Impacts of Natural Hazards and
Environmental Changes - Enhanced Support for Marine Commerce and
Transportation
11 Regional Associations
42
Existing Mid-Atlantic Sub-regional Observing
Systems - 2003
43
- Funding the Existing Annual Capacity in the
Mid-Atlantic - PORTS (5 x 200 K) 1 M
- NDBC (New Buoys, Amb, Ches) 1 M
- WRF _at_ WFOs (5 x 200 K) 1 M
- Southern New England Subregion 2 M
- Long Island Sound Subregion 2 M
- NY Bight Harbor Subregion 2 M
- Delaware Bay Subregion 2 M
- Chesapeake Bay Subregion 2 M
- Mid-Atlantic Region Obs 4 M
- Data Management 1 M
- Education Outreach 1 M
- Economic Impact 1 M
- Total 20 M
44
MARCOOS The Mid-Atlantic Regional Coastal Ocean
Observing System
Cape Cod to Cape Hatteras 1000 km Coastline
30 Co-PIs, 20 Institutions, 10 States
Investigator Affiliation Investigator Affiliation
A. Allen U.S. Coast Guard L. Atkinson Old Dominion University
A. F. Blumberg Stevens Institute of Technology W. Boicourt University of Maryland
W. Brown University of Massachusetts M. Bruno Stevens Institute of Technology
D. Chapman University of Delaware A. Cope NOAA Mount Holly WFO
A.Gangopadhyay University of Massachusetts T. Herrington Stevens Institute of Technology
D. Holloway OPeNDAP E. Howlett Applied Science Associates
D. King University of Maryland J. Kohut Rutgers University
B. Lipphardt University of Delaware A.MacDonald Monmouth University
J. McDonnell Rutgers University J. Moisan NASA Wallops
J. ODonnell University of Connecticut M. Oliver Rutgers University
O. Schofield Rutgers University H. Seim University of North Carolina
J. Titlow WeatherFlow Inc. D. Ullman University of Rhode Island
J. Wilkin Rutgers University R. Wilson SUNY, Stony Brook
W. Wittman Public Service Electric Gas M. Yarosh CIT
A. Voros NY/NJ COAST S. Glenn Rutgers University
45
MARCOOS The Mid-Atlantic Regional Coastal Ocean
Observing System
Cape Cod to Cape Hatteras 1000 km Coastline
- 30 Co-PIs, 20 Institutions,
- 10 States
- Regional Priorities
- Safety at Sea
- Search and Rescue
- 2) Ecosystem Decision Support Fisheries
- 3) Water Quality
- 4) Coastal Inundation
- 5) Offshore Energy
46
Success
Stories Making a Difference Optimizing HF
Radar for SAR using USCG Surface Drifters
Art Allen U.S. Coast Guard Scott Glenn Rutgers
University and the Mid-Atlantic Regional Coastal
Ocean Observing System
47
MARCOOS Theme 1 Maritime Safety Search And
Rescue
NOAA Coastal Site CODAR Currents SLDMB Drifter
MAB CODAR Network
SLDMB Drifter
Drifter Test Results CODAR Exceeds Present
Methodology
SAROPS Before CODAR Large Random Search Area
SAROPS After CODAR Small Stratified Search
Areas
48
Search And Rescue of Glider RU02 after drifting
for 10 days May 2004
Civil Air Patrol
Glider ru02 as seen from The search plane
Communication Plane
Search Plane
49
CODAR Network Phase 1
50
Management
CODAR Network Phase 2
Northern Operator
- Regional Coordinator
- Hugh Roarty
- Distributed Technicians
- Chris Jakubiak
- Adam Houk
- Ethan Handel
- Teresa Garner
Central Operator
Phase 3 10-12 People More Radars More
Spares More Robust Sites
Southern Operator
51
HF Radar Data Flow
Growing National Network
52
Project Status Report Long Range HF Radar
78 Data Availability October 1, 2007 to October
1, 2008
52
53
26 Sites
54
HF Radar Comparison to ADCP Surface Bin UWLS
OI
UWLS OI
Percent Coverage 93 95
RMS U (cm/s) 8.3 8.7
RMS V (cm/s) 7.9 7.5
R2 U 0.75 0.73
R2 V 0.63 0.65
55
Regional Theme 1 Maritime Safety, Search And
Rescue Existing Product Flow Chart
Individual Site Data Data Aggregator Forecast Product Generation Product Aggregator Decision Tool
STPS, (UConn)
MARCOOS Totals
HF Radar Radials
ROMS (Rutgers)
EDS
SAROPS
NOAA National Network
HOPS (SMAST)
MARCOOS
Year 1 2
NYHOPS (Stevens)
Year 3
56
National Plan Drafted 2008
National HF Radar Network 113 Sites from 27
Institutions
Rutgers NOAA East Coast Hub
Scripps NOAA West Coast Hub
NOAA Interface to HF Radar Derived Surface
Currents
57
Regional Theme 2 Ecological Decision Support -
Fisheries
58
Mid-Atlantic Regional Coastal Ocean Observing
System
4 Mid-Atlantic GliderPorts
Mid-Atlantic Glider Consortium Rutgers U., U.
Massachusetts, U. Maryland, U. North Carolina
59
North East Fisheries Science Center Stock
Assessment Surveys Spring Fall surveys
1963 present Use data from 2003 - present
gt 1000 station tows 223 species
2.5 mil individuals CTD data
Survey strata
Long Fin Squid, 1 year life span
Stations
Spiny Dog Fish, nuisance, protected
Summer Flounder
60
U.S. IOOS - Ecosystem Based Management
Large Marine Ecosystems Fisheries Surveys Argo
Drifters Met. Stations QuikSCAT Atmospheric
Forecasts Ocean Forecasts HF Radar
Altimetry Satellite Imagery Glider Fleets
1,000 km
Fall 2008 Glider Transects
61
(No Transcript)
62
A Framework for Research Investments in Ocean
Science for the coming Decade
- Theme 1 Stewardship of Natural and
- Cultural Resources
- Theme 2 Increasing Resilience to Natural
- Hazards
- Theme 3 Enabling Marine Operations
- Theme 4 The Oceans Role in Climate
- Change
- Theme 5 Improving Ecosystem Health
- Theme 6 Enhancing Human Health
- Three Central Elements
- Ocean Observing System
- Forecast Models for Key Ocean and
Ocean-Influenced Processes - Scientific Support for Ecosystem Based Management
http//ocean.ceq.gov/about/sup_jsost_prioritiespla
n.html
Deploying an ocean-observation system will
revolutionize the access to and view of the ocean
and increase the pace, efficiency, and scope of
ocean research.
63
A Framework for Research Investments in Ocean
Science for the coming Decade
- Theme 1 Stewardship of Natural and
- Cultural Resources
- Theme 2 Increasing Resilience to Natural
- Hazards
- Theme 3 Enabling Marine Operations
- Theme 4 The Oceans Role in Climate
- Change
- Theme 5 Improving Ecosystem Health
- Theme 6 Enhancing Human Health
IOOS - Seven Societal Goals 7) Enable the
sustained use of ocean and coastal
resources. 3) Allow more effective mitigation
of the effects of natural hazards 2) Improve
the safety and efficiency of maritime
operations 1) Improve predictions of climate
change and weather and their effects on coastal
communities and the nation 6) Allow more
effective protection and restoration of healthy
coastal ecosystems and 5) Reduce public health
risks 4) Improve national and homeland security
- Three Central Elements
- Ocean Observing System
- Forecast Models for Key Ocean and
Ocean-Influenced Processes - Scientific Support for Ecosystem Based Management
http//ocean.ceq.gov/about/sup_jsost_prioritiespla
n.html
Deploying an ocean-observation system will
revolutionize the access to and view of the ocean
and increase the pace, efficiency, and scope of
ocean research.
64
- U.S. National Science Foundation
- Ocean Observatories Initiative (OOI)
- Coastal
- Regional
- Global
- Cyber Infrastructure
- Education
- Ocean Observatories Initiative Goals
- Lay the foundation for the future of ocean
science - Build and operate the initial elements of an
ocean observatory bearing in mind the need for
transformative science and technologies - Coastal/Regional - high space/time resolution
embedded in a sparse federal/state network - Management - interinstitutional and federal/state
collaboration
65
NSF OOI CyberInfrastructure Chooses MAB as its
Testbed
66
The National Test-beds
Process Understanding New Technologies
A WELL SAMPLED OCEAN
OOI
IOOS
Sustained Regional Context Societal Impact
Forward Deployed Uses
Globally Aggregated Uses
Maritime Domain Awareness
Poles Climate Change Industrialized
Nations Developing Nations
Homeland Security
Defense
GEOSS
67
IMCS provides leadership in the providing new
technologies and training to the United States
Navy
No gliders
On the winning team for Navys LBS-G to outfit
the US fleets with gliders A official Naval
glider technical Center Provides training to
Navy and NATO field personnel Develops and
demonstrates the ability to sustain and linger in
denied areas
With gliders
68
IMCS is on the Leadership Team (Stevens-Rutgers-Mi
ami) for the DHS Center of Excellence for Port
Security
Maritime Domain Awareness Approach Dual Use
Technologies Demonstrate Nested Coverage
Global gt Approaches gt Port University of Miami
Global Satellite Coverage, Visible
Microwave Rutgers University
Over-the-Horizon Compact High Frequency Radar
Networks Stevens Institute of Technology
Local High-Resolution Optics Shallow
Underwater Acoustics
69
(No Transcript)
70
Global Reach - IMCS exports the locally developed
technologies globally to anchor efforts
throughout the world
GLOBAL REACH ANYWHERE ANYTIME
IMCS glider collaborations
IMCS CODAR collaborations
71
- The overall Scientific Goals for the NORUS
programme - Build an integrated ocean observatory
network/educational programme for climate-induced
variation of key-environmental variables on
marine bio-diversity in the Arctic - Implement an international undergraduate and
graduate partnership to train the next generation
of oceanographers using the facilities at NTNU,
Cal Poly, Rutgers University, and UNIS - The ultimate science goal is to strengthen
innovative academic relations to document and
understand how climate induced changes impact
living resources and ecology of the Norwegian
coast, Barents Sea, and the Arctic Ocean
72
- NORUS Partner Institutions
- Norwegian University of Science Technology
- (NTNU), Geir Johnsen
- University Center of Svalbard (UNIS),
- Jorgen Berge
- California Polytechnic State University (Cal
Poly), - Mark Moline
- Rutgers University Coastal Ocean Observation Lab
- Oscar Schofield and Scott Glenn
First NORUS Workshop UNIS, Svalbard March 15-21,
2009
73
- NORUS Partner Institutions
- Norwegian University of Science Technology
- (NTNU), Geir Johnsen
- University Center of Svalbard (UNIS),
- Jorgen Berge
- California Polytechnic State University (Cal
Poly), - Mark Moline
- Rutgers University Coastal Ocean Observation Lab
- Oscar Schofield and Scott Glenn
First NORUS Workshop UNIS, Svalbard March 15-21,
2009
74
Technology partnerships NORUS (University of the
Trondheim, California Polytechnic State
University, and Rutgers University)
Norwegian US students
SUMMER 2009 NORUS Glider Effort
75
Norwegian Navy/NOBLE Program for Ship
Surveillance and Environmental Monitoring around
Nordkap
- Current map coverage from proposed Long-Range
SeaSonde Sites
Russian Border
76
Vessels of Interest
"Moscow" Oil Tanker Length 243 m Height 70
m RCS 46 dBsm 5 dBsm
"Oleander" Type Length 119 m Height 30 m RCS
36 dBsm 4 dBsm
Fishing Trawler 14-m high mast RCS 28 dBsm
77
Backscatter KJOL
Predicted Vessel Tracking Coverage
Backscatter SKAG
Bistatic KJOL gt SKAG
78
Need for Coordination of Basin-Scale North
Atlantic Studies
- Connectivity in the North Atlantic is determined
by the large-scale gyres that span the basin. - Basin-scale forcing impacts biogeography and
ecosystem structure and function locally and
across the entire region. - The ecosystem approach to management of widely
distributed fish and other key species requires
basin-scale understanding. - The North Atlantic system is a key ocean basin
globally for the sequestration of carbon.
79
New Data Acquisition Deep Ocean Work Integrated
with on-going national programs.
New Technologies Physical Satellite
Salinity Chemical In situ nutrient
sensors Biological Optical imaging Molecular
genetic New P/B Platforms Drifters Gliders
Advanced moorings Shipboard Observations
Process studies
80
HYCOM Consortium for Data Assimilative
Modeling http//hycom.rsmas.miami.edu/
NRL Stennis (Global) Real-time Experiment,
Global, 1/12 Degree Grid
NOAA/NCEP (Atlantic) Operational Ocean Analysis
and Modeling, Atlantic HYCOM Nowcast/Forecast Curv
ilinear Grid, 5 km on west, 9-17 km on east
81
Whats Missing?
Money? More Sensors Platforms? More
Coupled Models? International Home?
82
Whats Missing? Young People
How do we entrain educate the next generation
of global oceanographers? Focus on the pipelines
Early Career Scientists and Undergraduates
83
Long-duration Glider Missions - Undergraduate
Education RU15 - New Jersey to Halifax
2008 RU17 - New Jersey to Azores (Almost) -
2008 RU27 - New Jersey to Europe (We Hope) - 2009
RU17 The Scarlet Knight
84
Glider RU27 (The Scarlet Knight) Track and
Currents
85
Glider RU27 (The Scarlet Knight) Rutgers SST
Imagery
86
Glider RU27 (The Scarlet Knight) Colorado
Altimeter SSH
87
Glider RU27 (The Scarlet Knight) NRL SSC HYCOM
88
World Population
x 1000
Data Source UN Population Division, The 2006
Revision Population Database Medium Variant
http//esa.un.org/unpp/index.asp
89
HMS Challenger Mission 1872-1876 First
Dedicated Global Ocean Science Cruise
Can a globally distributed network of early
career scientists students repeat the
Challenger Mission with a coordinated fleet of
underwater robotic gliders?
2012 - ????
Recommended
