
Direct Runoff Hydrograph PowerPoint PPT Presentation
1 / 32
Title: Direct Runoff Hydrograph
1
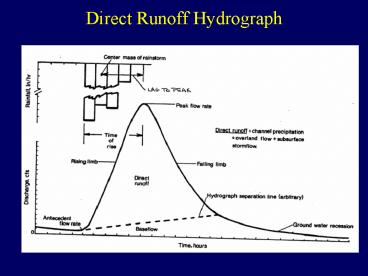
Direct Runoff Hydrograph
2
Annual Hydrograph Water Year (Oct Sept)
3
Hydrograph Metrics
- Volume (L, L3)
- Peak Discharge (L3/t)
- Flow Duration (t)
- Time to Peak (Rise) (t) ( time_start -time_peak)
- Lag to Peak (t) ( rain_cofm time_peak)
- Lag to Center of Mass (t) ( rain_cofm
runoff_cofm)
4
Flow Paths
- Direct Channel Interception of Precipitation
- Overland Flow
- Shallow Subsurface Flow
- Deep Subsurface Flow
- Groundwater Flow
5
Streamflow Response
- Type of Responses from a precipitation event
- No Response Input is least then watershed
storage - Baseflow Response Only
- Direct Response Only
- Mixed Response
6
Factors at Affect Streamflow Response
- Precipitation Characteristics (most important)
- Antecedent Moisture Conditions
- Watershed Characteristics
- Topography Area, Slope, Drainage Density
- Channel Type, Slope
- Geology/Soils Depth to Bedrock, Infiltration
- Land Cover Type and Condition
- Impervious Area
7
Precipitation Characteristics
- Type Rain vs. Snow
- Most flooding events on small watersheds are from
rain events. - Large basins have seen major floods from quick
snowmelt event, usually the result of rain on
snow. - Amount Is it greater then watershed storage
- Intensity Is it greater then infiltration
capacity - Frequency Affect on antecedent moisture
conditions - Direction Relative to drainage.
- Distribution Extent of event over watershed
8
Precipitation Process
- Frontal Systems
Small Extents Larger Extents Shorter
Durations Longer Durations Higher
Intensities Lower Intensities
9
Precipitation Process
- Orographic
Variable Extents, Durations, and
Intensities Storm tracts through mountains are
common.
10
Precipitation Process
- Conventive
Smaller Extents 1-1.5 sq. miles in size,
elliptical shape Short Durations Higher
Intensities
11
Precipitation Characteristics
- Duration, Amount and Intensity
- Long Duration, Low Intensity Exceeds Storage
- Flooding in the Gulf Coast
- Short Duration, High Intensity Exceeds
Infiltration - Local Flooding in Tucson
- Longer the Duration the lower the average
Intensity - Major flooding events have resulted from stagnate
frontal systems - Many studies have correlated Qp to rainfall
intensities - The basis of the Rational Method
- Qp CIA, where I is rainfall intensity
12
AMC
13
Direction
14
Watershed Factors
Flashy
Flat
15
Affect of Geology
Annual hydrographs for two streams in central
Michigan with similar precipitation regimes. One
watershed is on granite and the other is on
limestone.
16
Land Use Impacts
- The major impact of management on flooding is the
increase in routing efficiency. Excess rainfall
generated on the watershed is routed more quickly
to the watershed outlet. - Management has little impact on large return
period events (e.g. 100 yr) especially at large
watershed scales. - Impacts include
- Increase in Overland Flow
- Change in Land Cover and Land Use
- Increase Impervious Area
- Increase in Drainage System (ditches, gullies,
roads) - Decrease in Internal Storage (removal of
wetlands) - Increase in Drainage System Efficiency
- Change channel characteristics (width/depth,
roughness) - Channel confinement (levees)
17
Fire
- Vegetation Removal and Mortality
- Sever Fires can have 100 Mortality
- Modification of hydrology cycle
- Decrease in ET and interception
- Increase in snow accumulation
- Increase soil water availability
- Removal of Surface Material
- Creation of bare soil
- Increase potential for overland flow
- Modification of Surface Soil
- Destruction of surface soil aggregates
- Increase in bulk density
- Decrease in porosity
- Create soil hydrophobicity
- Soil Sealing (raindrop impacts, ash)
- Water Repellent Layers
Paired watersheds in Cascade Range in E. WA
18
(No Transcript)
19
Marshall Gulch (Variable Burned 8.9 sq. km
conifer watershed, C)
20
Runoff vs Rainfall for Marshall Gulch (8.6
sq.km.) Before and After Aspen Fire
21
Post Fire Peak vs Average Discharge At Marshall
Gulch Before and After Aspen Fire
22
Pre- Fire Hydrograph
Post - Fire Hydrograph
23
Arizona Example Ponderosa Pine
Unburn Moderate Severe
Area (ha) 17.7 4.0 8.1
Exposed Soil () 7 36 70
ROE (1973-75) () 0.8 2.8 3.6
of Rain/Runoff Events (1973-75) 6 15 25
Largest Peak Discharge (cfs) 6.1 21.5 lt336
Infiltration (cm/hr) 6.9 3.7 2.6
24
Forest Management
- The impact of road building on drainage is
considered important. Increase routing
efficiency. Roads can decrease the time to peak. - Changes in available soil water and snow
accumulations. - From individual small experimental watersheds
forest management has been found to change
stormflow peak discharge from -22 to gt200 and
stormflow volumes from 0 to 200. Note most of
the storms that were analyzed were relatively
small. - Biggest impacts are on the low return period
events (lt 50 yr). The impacts are less clear for
higher return period events. One problem is that
we have a very small sample of rare large events.
25
Casper Creek Example Northern CA
- Coastal Redwoods, Rain Dominated
- The average lag to peak time decreased an average
1.5 hours. The shape of the hydrographs did not
change. - Small storm volumes (lt 1200 m3) were increased by
132 and the peak discharges (lt 566 l/s) were
increased by 111. - Storm volumes and peaks for large events were not
significantly increased.
26
(No Transcript)
27
(No Transcript)
28
Reservoir Response Uncontrolled Outlet
29
Urbanization
30
Tucson Example
Atterbury Arcadia Wash High School Wash Railroad Wash
Developed 0 22 30 42
Average ROE () 6 22 27 29
of Runoff per Rain Event 13 35 52 41
San Diego, CA The 2-year flood volume would
double on major streams, and increase by four
times on urbanized tributary streams. Similarly,
a 100-year flood volume would increase by 1.3
times on major streams and by 3 times on
tributaries (Prestegaard 1975).
31
Desynchronization of Hydrographs
- It has been hard to assess the impact of land use
on flooding at large watershed scales. - Because land use can change the lag to peak of
event hydrographs the impact downstream may
actually decreased as flows from different
tributaries are combined. - Note that even relatively large cities will
represent a small portion of larger watersheds. - Flooding control structures like detention basins
can complicate the issue.
32
Desynchronization of Hydrographs
- Hydrographs from different tributaries can have
different shapes and timing due to management or
natural factors. - Factors include
- Watershed shape
- Watershed and channel slope
- Drainage density
- Channel Characteristics
- Internal retention or detention
Recommended
