
Network Management Tools Presentations PowerPoint PPT Presentation
Title: Network Management Tools Presentations
1
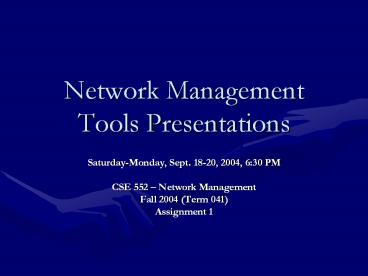
Network Management Tools Presentations
- Saturday-Monday, Sept. 18-20, 2004, 630 PM
- CSE 552 Network Management
- Fall 2004 (Term 041)
- Assignment 1
2
Schedule of Presentations
Speaker(s) Tool
Bandar Al-Saifi PRTG
Mohammed Aijaz Mohiuddin windump
Abdullah Basalamah Saeed Bawazir CyberGauge
Baher Y Al-Ramady MRTG
Husain Al-Saeed Visual Route
Saad Ibrahim Al-Howaymel Wael Abdul -Jalil Hamri jffnms
Adel S. Al-Shahrani NetRAT
Khaled Al-Utaibi LANsurveyor 8.5
Fahd Abdul Hameed ManageEngine opManager
Khaled Al-Motairi CommTraffic
Fawaz M. Alhazemi Graph.pm ChartGraph
Hassan Al-Matouq Simple Router Grapher http//snmprg.sourceforge.net/
Mazhar Ali Iqbal LANsurveyer http//www.neon.com/LSwin.html
Yasser Al-Sawy SNMPc http//www.castlerock.com
3
Network Management Tool with PRTG
- What is PRTG.
- What PRTG can do for you.
- How PRTG works.
- How to configure PRTG.
- 1. Add a new sensor.
- 2. Access Sensor Data.
- 3. Sensor Settings.
- 4. Setting PRTG Program Options.
4
(No Transcript)
5
(No Transcript)
6
(No Transcript)
7
(No Transcript)
8
(No Transcript)
9
(No Transcript)
10
(No Transcript)
11
(No Transcript)
12
(No Transcript)
13
Network Analyzer(WinDump) By Mohammed Aijaz
Mohiuddin 230417
14
Brief Overview of Network Analyzer
- It is GUI interface to command line tool
windump(on windows). - Functions-
- 1) Capture and display network packets
- 2) Display packets stored in a file
- 3) Capture network statistics
- 4) Perform real-time network monitoring
- Requirement-
- WinPcap Driver. This driver allows most
types of network cards to be placed in
promiscuous mode. - Input- user activity.
15
Output Display of Packet Information
16
Output Network Statistics
17
Output Real-time Network monitoring
18
What more can be done Some of Many are as
follows..
- Can capture the traffic of a specific host or
specific subnet - Some PCs may have multiple interfaces. Traffic on
a specific interface can also be obtained. - Incoming traffic to a host or Outgoing traffic
from a host or Both can be captured. - Can store the result to a dump file for later
purpose. - Thank you.
19
CyberGauge
Network Management Tool
- By
- Saeed Bawazir
- Abdullah Basalamah
- CSE 552
20
Agenda
- Overview of CyberGauge Network Management Tool
- Uses of the Tool and Examples
- Conclusion
21
Overview
- Windows-based Application Neon Software, Inc
- Monitor switches, routers, hubs, servers. Etc.
- SNMP and MIB II
- Automatically create
- utilization graphs
- daily, weekly, and monthly quality of service
(QoS), - Receive alerts for both non-responsive devices
and traffic thresholds - Monitor 5, 10, 20 or 100 devices
22
How it works
- sends an SNMP query over network to router's MIB
- Several SNMP queries were sent to the router to
compile a list of the network interfaces present
on that router, along with each interface's
maximum speed and its type. - another SNMP query was sent to obtain the
router's name, type, location, how long the
router had been running, and the person
responsible for maintaining the router. - determine how much bandwidth was consumed during
the Monitoring Rate interval, and calculates the
percentage of the total bandwidth available
23
Input
24
Output
25
Output
26
Uses of the Tool and Examples
27
Uses of the Tool (Device Information)
- CyberGauge Provides the troubleshooter
- Name, Type Location of network device
- Uptime
- Number of interfaces.(useable/unuseable)
- Party responsible for device
28
Uses of the Tool (Interface Information)
- For each interface
- Interface name
- VLAN
- IP address
- Type of network connection (Ethernet,..)
- Max. speed (not actual)
- Status
29
Uses of the Tool
By CyberGauge CCSE Primary Switch
Device Interfaces Information
30
Uses of the Tool (Performance Management)
- Monitor Network Connectivity
- Throughput
- Link Utilization
- Statistics Collection
31
Examples (CCSE ITC)
The IP address used 196.1.65.253
Interfaces Statistics
32
Examples (CCSE ITC)
MRTG IN/OUT Throughput for Up Link CCSE-ITC
33
Examples (CCSE ITC)
All Interfaces Can be Monitored
34
Examples (Local Company)
IN/OUT Utilization for 128K Leased Line
35
Examples (Report Generation CCSE Interface)
- Report can also be generated as the device
- and interface is specified.
- Sample Test for an interface in CCSE Switch
- Date Time IN (Kbps) OUT (Kbps)
- 09/15/04 113328 252.9 82.4
- 09/15/04 113343 236.1 61.1
- 09/15/04 113358 161.9 48.8
- 09/15/04 113413 184.8 36.7
- 09/15/04 113428 67.6 108.4
- 09/15/04 113443 202.2 28.2
- 09/15/04 113458 283.9 134.3
- 09/15/04 113513 336.3 66.5
- 09/15/04 113528 179.0 119.6
- 09/15/04 113543 223.8 52.1
- 09/15/04 113558 615.9 39.4
36
Conclusion
- CyberGauge
- Utility for monitoring bandwidth information from
any SNMP-based device - Answer critical questions How much of my
Internet bandwidth am I currently using? Are
slowdowns in Internet access related to increased
use of my Internet connection? Am I getting
the bandwidth promised by my Internet Service
Provider (ISP)?
37
MRTG
- Baher Al-Ramady
- 978504
38
OUTLINE
- What is MRTG
- How it works
- How to use it.
- Example 1
- Example 2.
39
Multi Router Traffic Grapher
- Monitor the traffic load on network-links.
- Open Source Code. Perl C.
- SNMPv1 SNMPv2.
- Visual representations of the traffic.
40
How MRTG Works
- SNMP request.
- Log the response.
- File size does not increase.
- Graph the polled data.
41
How to use it
- IP, Community OID.
- SNMP Agent.
- perl cfgmaker options community_at_router1
- cfgmaker public_at_10.221.0.65
- Make .cfg file.
- Workdir d\inetpub\wwwroot\
- Interval 5
- RunAsDaemon Yes
42
Example 1 (Cat3550-335-1145 in 22-335-1 )
Standard Interface MIB
43
Example 1 (Graph)
44
Example 2
1.3.6.1.2.1.31.1.1.1.6.index
45
Example 2 (Graph)
46
Conclusion
47
Visual Route Server
48
Function
- This VisualRoute Server provides a graphical
traceroute from this server to any other network
device you choose, useful for pinpointing network
connectivity problems and identifying IP
addresses. - VisualRoute Personal Edition combines essential
networking utilities, including traceroute, ping,
WHOIS, and reverse DNS, to determine precisely
where and how traffic is flowing on an Internet
connection, providing a geographical map of the
route and the performance of each segment.
49
VisualRoute Features
- See actual IP address locations - identifies the
physical city/country location of IP addresses --
which is often quite different from the IP
registration location -- and shows the path of an
Internet connection on a global map. - Worldwide WHOIS reporting - get instant domain
and network registration information from
worldwide databases, so you can easily report a
network problem or investigate an IP address.
50
VisualRoute Features
- Internet connectivity analysis - answers the
question "Why can't I get there from here?" by
providing an analysis of the Internet from where
you are to where you want to go. VisualRoute will
help you to determine if a connectivity problem
is due to your ISP, the Internet, or the host you
are trying to reach, and pinpoints which network
(ie. WorldCom, Verio, Ebone, MSN) a problem is
in. - Automated ping reporting - the Ping Grapher tool
continuously monitors the response time of a
network host. - Application port testing - reports the
availability of popular IP services including
POP3, FTP and SMNP.
51
VisualRoute Features
- eMailTracker - traces an email address to its
email server, providing helpful information for
resolving email problems. For identifying the
source of emails that have been received, use
VisualRoute together with the popular
eMailTrackerPro product.
52
VisualRoute Outputs
- VisualRoute provides three types of data an
overall analysis, a data table, and a
geographical view of the routing. - The analysis section provides the number of
routing hops, where problems occurred, the web
server software running at the destination site,
and identifies any routing loops. - The data table lists information for each hop,
including packet loss, IP address, node name,
geographical location, ping response and the
major Internet backbone where each server
resides.
53
VisualRoute Outputs
- The zoomable world map gives a graphical
representation of the actual path of an Internet
connection.
54
VisualRoute Outputs
55
Example 1www.ibm.com
56
Example 1www.yahoo.com
57
JFFNMS
- Saad Alhowaymel
- Wael Hamri
58
Introduction
- JFFNMS is a Network Management System designed to
maintain SNMP / Syslog / Tacacs Networks. - It can be used to monitor any standards
compatible SNMP devices, Servers, or TCP ports. - JFFNMS can take input from
- syslog
- SNMP traps
- poll a network element for its status
59
Features
- Alarming of syslog and SNMP trap events
- SNMP polling of router, switch and network
interface status - Graphing of various statistics of network device
interfaces - Graphing of host information such as CPU, memory
and disk info. - Notification via email based upon complex alarm
filtering - Configurable Event Types and Security Levels
60
Features
- Advanced Event Filter
- Interface Auto-discovery
- Open Source
- http//sourceforge.net/project/showfiles.php?group
_id46041 - Total Administration via web
- Etc..
- www.jffnms.org/features.php
61
Installation
- Install Apache Windows
- Install MySQL
- Install PHP
- Install JFFNMS
- Integration Packages
- Install RRDTOOL
- Install NMAPWin
- Configuration
62
Definitions - (SNMP)
- An application layer protocol that facilitates
the exchange of management information between
network devices. - It is part of the Transmission Control
Protocol/Internet Protocol (TCP/IP) protocol
suite. - SNMP enables network administrators to manage
network performance, find and solve network
problems, and plan for network growth.
63
Definitions - TACACS
- A recent protocol providing detailed accounting
information and flexible administrative control
over authentication and authorization processes. - Facilitated through AAA and can be enabled only
through AAA commands. There is a draft RFC
detailing this protocol.
64
Definitions syslog.
- This protocol has been used for the transmission
of event notification messages across networks
for many years. - Developed on the University of California
Berkeley Software Distribution
65
Definitions
- Hosts All network devices or network elements
- Interface an attribute or property of a host
something you want to monitor on the host - Interface type describes what information needs
to be collected, stored and how it is discovered
- Raw event Information comes from various external
sources syslog line or SNMP trap - Alarm is a status change of an interface
66
Demo
- Administrators are Users who are doing work on
the JFFNMS system itself adding users, changing
interfaces and even working on the pollers or
notifications screens. - Operators are Users who would use JFFNMS as a
monitoring tool, but they don't change JFFNMS
configuration. - customers are people who are assigned interfaces
and may get a username (but not be a User) to see
the performance of those interfaces.
67
Demo
- http//jffnms.netzwerker.net/
68
Thank you
69
Network Management Tool
- By
- Al-Shahrani, Adel S.
- 986074
- September 18,2004
70
Outline
- Introduction
- Tools Features
- Downloading, installation
- Using tool
- Conclusion
71
Introduction
- NetRAT Software provides network discovery and
analysis software that - Discover, analyze and compare assets found
across the enterprise. - It can compare historical reports highlighting
changes, additions and deletions to the network
72
Tools Features
- Discovery of resource types (provider, domains,
workgroups, computers or terminal shares) - SNMP analysis displays devices and details if
filled out on the box in a network tree view or
network diagrams. - LDAP E-mail
- Customized ping, portscans, Traceroute and WHOIS
73
Tools Features (Cont.)
- Detailed discoveries can be run against
- Servers
- Accounts
- Groups
- Privileges
- File Security
- Registry Viewing
- Files/Keyword Searches
- Differential Analysis
- Log Analysis
- Reports, Charting and Diagramming
- Data Protection
74
Downloading Installation
- By downloading trial version from NetRAT Site.
- Run Setup.exe and complete installing the tool
75
Using the Tool
76
(No Transcript)
77
(No Transcript)
78
(No Transcript)
79
(No Transcript)
80
(No Transcript)
81
(No Transcript)
82
(No Transcript)
83
(No Transcript)
84
(No Transcript)
85
(No Transcript)
86
(No Transcript)
87
(No Transcript)
88
(No Transcript)
89
(No Transcript)
90
(No Transcript)
91
(No Transcript)
92
Conclusion
- NetRAT is network discovery tool
- Reports
- Compare Historical Data
- Protecting Data
93
Thank You
94
LANsurveyor 8.5
95
Introduction
- LANsurveyor is a network management software .
- Use to automatically map networks of any size.
- Provide a graphical interface so you can manage
your network from anywhere on the network. - Provide software and hardware inventory reports.
96
(No Transcript)
97
Enter Map Parameters
98
Draw Your Map
99
Create Poll Lists
- Verifies that map objects are responsive
- Provides statistics on how quickly the object
responds.
100
Poll List Window
101
Conclusion
- Trail period one week.
- 495.
- www.neon.com.
102
CSE 552Network Management
- Name Fahd Ahmad Abdulhameed
- ID 978509
- ManageEngine OpManager 5
- 18 September 2004
103
ManageEngine OpManager 5
- System Requirements
- Features
- How is it work?
- Samples
104
ManageEngine OpManager 5
- System Requirements
- Any 32-bit x86 compatible Processor running above
700 MHz - 512 MB RAM
- 200 MB Hard disk space
- 24-bit color display
105
ManageEngine OpManager 5
- OpManager Features
- WAN Monitoring
- Server Monitoring
- Switch Monitoring
- Printer Monitoring
- CPU, Memory Disk Monitoring
- Fault Performance Monitoring
- Adaptive Management
- Networking Tools
- Client Options
106
ManageEngine OpManager 5
107
ManageEngine OpManager 5
108
ManageEngine OpManager 5
109
CommTraffic
- CSE 552 Network Managment
- Name Khaled Al-Motairi
- ID 983072
110
Overview
- Displays statistics in graphical and numeric form
- generate an array of reports that reflect the
network traffic volume and Internet connection
expenses - view the traffic statistics by local hosts,
remote hosts, IP protocols and remote/local
TCP/UDP ports
111
Example
112
(No Transcript)
113
(No Transcript)
114
(No Transcript)
115
(No Transcript)
116
(No Transcript)
117
- WWW http//www.tamos.com
118
WHAT IS Perl?
- Perl is a language like C/C, C, JAVAetc.
- Open Source.
- Can be run over most existence platforms.
119
Perl Network Management
- Two ways to implement SNMP in Perl
- Call command-line programs
- (e.g. UCD-SNMP)
- Need a community name on the command line.
- Using Perl SNMP module.
- NetSNMP by David M. Town
- SNMP_Session.pm by Simon Leinen
- SNMP Extension Module v.3.1.0 for UCD SNMPv3
library (or SNMP)by G.S. Marzot.
120
Perl SNMP modules
NetSNMP SNMP_Session.pm SNMP
SNMPv1 ? ? ?
SNMPv2 ? ?
SNMPv3 ?
121
Perl SNMP modules (cont.)
- SNMP need to be linked against a separate
pre_built UCD-SNMP library, while NetSNMP and
SNMP_Session.pm can work with Perl alone. - UCD-SNMP library can be built in your platform.
- Best selection is SNMP.
122
Examples
- Check handout given
123
Questions
124
Simple Router Grapher (SRG)
- By
- Hassan M. Al-Matouq
125
Outline
- Introduction to SRG
- Overview of SRG
- Applications
- Examples
126
Introduction
- Delphi Applic.
- Monitors SNMP device/local computer
- Displays info as a graph/text
127
Overview
- Local Computer asks Windows for values
- Host name
- Local IP
- Upload/download
- CPU usage
- Free/used RAM
- Uptime
- Free disk space
128
Overview
- SNMP Device sends SNMP queries (OID)
- Host Name
- IP
- Download/uploadetc.
129
Overview
130
Overview
131
Overview
132
Applications
- Monitoring traffic
- Collecting statistics
133
Examples
134
Examples
135
LANsurveyor
- CSE-552 Network Management
136
Overview Features
- LANsurveyor is easy to use, proven network and
desktop management software. - Draws network map showing the logical
connectivity of your network - Make queries to network objects
- Scan your network for intruders. (Intrusion
Detection System)
137
Overview Features
- Real-time Network Monitoring using alerts
- Generates Managed Hub/Switch Reports
- Asset Management
- Desktop Management (Shutdown, Restart,
synchronize clocks)
138
Draw Logical Network Map
- Select the protocols to use for searching
- Provide community strings for SNMP devices if
any. - Provide IP Address range to saerch
139
Draw Logical Network Map
- Sends
- SNMP Requests
- ICMP Request
- Searches
- Subnets
- Nodes
- Routers
- Switches
140
Draw Logical Network Map
141
SNMPc from Castle Rock Computing
- Yasser Alsawy
142
Features
- Monitors SNMP devices, WAN Links, Servers and
Applications - Supports SNMP v1, v2 and secure SNMP v3
- Scalable, Distributed Architecture
- Email/Pager Event Notification
- Vendor Independent - Manages any SNMP device from
any vendor - Key Network Metrics (e.g. Utilization)
- Automatic WEB Printed Trend Reports
- Live/Standby Servers with automatic failover
- Automatic Baseline Alarms
- Runs as Windows Service
- Remote Console JAVA Access
- Real-time MIB Displays
- Automated Network Discovery
- Programming Interfaces
- OEM Version Available
143
Two types offered
- SNMPc Enterprise Edition employs a distributed
polling agent architecture to provide a high
performance solution capable of monitoring
networks from several hundred devices to tens of
thousands. Remote software and Web based consoles
provide network information to everyone who needs
it. - SNMPc Workgroup Edition is an affordable version
of SNMPc suitable for a single user and small to
medium sized networks.
144
Scalability
- Multiple Login Consoles
- SNMPc Enterprise provides remote access
consoles through JAVA or Windows based client
software. Each remote user is assigned a security
level and unique view of the network based on
their user login. The ability to provide
individual network views is useful in large
corporate or MSP/ISP environments. - Manager of Managers
- SNMPc Enterprise can be deployed as a
hierarchical management system providing a single
view for multiple branch level SNMPc
installations. A full peer-to-peer architecture
is supported where each SNMPc Enterprise can be
both a branch and top level manager
simultaneously. This lets you to deploy a
scalable fault tolerant management system.
Existing customers have used this architecture to
deploy solutions monitoring networks in excess of
200,000 devices.
145
Reliability
- Live/Standby Servers
- To ensure a reliable 24/7 network monitoring
solution SNMPc Enterprise supports live/standby
management servers. The backup SNMPc server
continually monitors the primary server and in
the event of a failure automatically takes over
all network management functions. An automated
failover process includes the reconfiguration of
any distributed polling agents in the network.
Through the standby server feature, users can
continue to monitor their network if the primary
system is disabled through system failure, human
error or other unforeseen circumstances.
146
Console options
- JAVA Console
- The SNMPc Remote Access Extension supports a
JAVA based remote console. The JAVA console can
be used from any Internet or Intranet connected
computer, including Apple, Linux and Windows
systems. The SNMPc Java Console is optimized for
low speed WAN lines, making it well suited for
use by outsourced Network Service and Help Desk
personnel. - Basic functionality includes user specific
topology map displays, event log views, and
real-time MIB table/graph displays. Long-term
trend reports can be viewed after selection with
a calendar control. Also included is a JAVA proxy
Telnet application for configuration of Cisco
routers and other devices.
147
Network mapping
- Advanced Network Mapping
- SNMPc supports a multi-level hierarchical map.
Each hierarchy can represent cities, buildings,
or subnetworks. Imported bitmaps of geographic
maps or floor plans, along with manual or
automatic network placement, lets you create a
layout that closely matches the actual network. - SNMPc can automatically lay out each map
network as a tree, ring, or bus topology. Each
map object uses a device specific or user
selected icon, and the object color indicates the
device status. You can start any device specific
application by double clicking map icons. - The Map Navigation Tool Window displays the map
as a tree for direct selection of objects. The
Navigation tree also displays the current alarm
status of each subnet to quickly locate failing
devices. - The map window Full Zoom feature automatically
moves and zooms the view so that all devices are
always visible in the window. The Pan/Zoom
feature lets you select a region to zoom into
from the complete set of devices in a view.
148
Monitoring Alerts
- Availability and Status Polling
- SNMPc automatically discovers and polls
SNMP/ICMP, WEB, FTP, SMTP, and TELNET services,
as well as up to 16 user-selectable TCP services
per node. Each application can also be configured
to match on "success strings" returned by the
service. Along with real-time service status,
SNMPc Enterprise also provides WEB-based
Availability Reports. - Automatic Threshold Alarms
- Once Trend Reporting is setup, Polling Agents
monitor all report variables for a learning
period and calculate a baseline for typical
patterns. - Thereafter, the Polling Agents compare the
actual polled data to the baseline and generate
alarms when variables deviate excessively from
the baseline. Polling Agents automatically adjust
baselines as traffic patterns change. You can
also manually configure alarm thresholds for any
polled variable. - Alerting
- SNMPc changes the color of map objects and
performs other actions based on received events.
Event Action Filters select the action to take
when an event occurs. An "easy event" filter
option lets you to create event filters directly
from log file entries. - SNMPc offers a wide range of event actions
including - Email, Page
- Play WAV Sound
- Execute Application
- Forward SNMP Trap
- Pop-up Alarm Window
149
Trend Reporting
- Scheduled Printed and WEB Reports
- SNMPc Enterprise automatically generates
scheduled daily, weekly, and monthly statistic
reports. Report formats include graph, bar chart,
distribution, and summary. They can be exported
to a variety of destinations, including printers,
files, or a WEB server. - SNMPc Enterprise report setup is very simple.
After selecting a group of nodes, simply select
the report, the reporting style, destination, and
schedule. SNMPc Enterprise automatically collects
the data and gererates the reports. You can use
the included TrendView application or a WEB
browser to view reports from any workstation. - ODBC Export
- SNMPc Enterprise can automatically export all
saved long-term statistics to industry standard
ODBC databases. Use familiar tools such as
Seagate Crystal Reports or Microsoft Access to
generate customized trend reports.
150
Setup
151
Discovery seed
152
Manage console
153
Active events
154
Hub view
Recommended
