
ECG EEG PowerPoint PPT Presentation
1 / 42
Title: ECG EEG
1
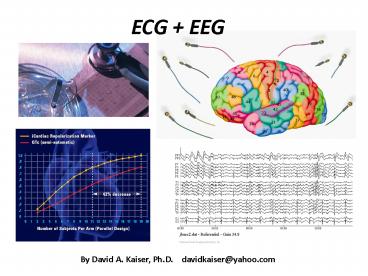
ECG EEG
By David A. Kaiser, Ph.D. davidkaiser_at_yahoo.com
2
Commec
Commercial Academic
Senior Editor (editor in charge)
David A. Kaiser Applied Neuroscientist PhD, UCLA
in Psychology MFA, University of Iowa
3
Periodicity Table A framework to measure all
possible synchronies between signal generators
4
Phase space in EEG indicates time delay between
brain areas recruited into the same operation
(rhythm)
Out of phase (180 degree lag) In
phase (0 degree lag)
5
The more neurons recruited into a rhythm, the
higher the spectral magnitude and power
- spectral power magnitude squared (epoch level)
6
History of EEG phase magnitude investigations
Early phase descriptions Adrian EDK Yamagiwa
(1935) The origin of the Berger rhythm, Brain, 58
323-351. Motokawa K Tuziguti K (1944). Alpha
phases in EEG activity. Japanese Journal of
Medical Sciences, 10, 23-38. Computation of
Coherence Goodman, N.R. (1957, diss.). On the
joint estimation of the spectra, cospectrum and
quadrature spectrum of a two-dimensional
stationary Gaussian process. Princeton Univ. JW
Tukey advisor Walter DO. (1961).Spectral
analysis for electroencephalograms mathematical
determination of neurophysiological relationships
from records of limited duration. Experimental
Neurology, 8, 151-181.
Early magnitude descriptions Berger H. (1929).
Ueber das Elektroenkephalogramm des Menschen.
Archiv Psy Nerv, 87, 527-570. Dietsch, G.
(1932). Fourier-analyse von Elektrenkephalog. des
Menschen. Pflüger's Arch. Ges. Physiol., 230,
106-112. Computation of Comodulation Kaiser,
DA. (1994, diss.). Interest in Films as Measured
by Subjective Behavioral Ratings and
Topographic EEG. UCLA. MB Sterman,
advisor Sterman, M.B. Kaiser, D.A. (1999).
Topographic analysis of spectral density
co-variation normative database and clinical
assessment. Clinical Neurophysiology, 110 (S1),
S80.
7
Activity and Connectivity
8
Frequency information localized and shared
- Coherence
- (Wiener, 1930 Goodman, 1957 Walter, 1961)
- Comodulation
- (Pearson, 1896 Kaiser, 1994)
9
Signals are
- coherent when phase difference is stable
- comodulated when magnitude difference is stable
10
How to show 361 (19x19) site-pairs
Raw Data VIEWS Statistical
11
Data and Statistical (z) views
12
Shared information between two signals
- Magnitude
- Mean consistency (comodulation)
- Mean difference (asymmetry, unity)
- Phase
- Mean consistency (coherence)
- Mean difference (phase lag)
13
Network Maps (anterior callosotomy case
14
Autistic child, replicated EC
15
Normalization, montage issues with correlative
indices
FISHER Z Distribution normalization (in one
tail) of comodulation and coherence values via
Fisher-z transformation. This transformation
corrects probabilities associated with change in
a correlational parameter as it approaches
perfect coupling. In other words, it accounts for
the fact that more order is required to move
towards 1.0 correlation than disorder is needed
to move the same distance away from
MONTAGE Radial and tangential components of
electrical activity spread activity across
multiple electrodes with referential montage.
Laplacian techniques correct it but corrupt
correlational analyses such as coh and comod.
Degree of coupling is overestimated with
referential montage but underestimated with
Laplacians., so we must decide whether source
locality is more important than coupling
strength, and vice versa.
16
Source of most EEG sinusoidal rhythms (spindles)
- Length of inhibitory potential sets the frequency
(which is mediated by GABA type A receptors) .
The potential determines the time until another
burst of spikes is generated by the TC neuron
(Franks, 2008)
17
Homotopic callosal connections or ipsilateral
pathways only
- Four types of cortico-cortical projections
- 1) homotopic, 2) homoareal, 3) heterotopic, and
4) ipsilateral
18
Kaisers Brodmann Montage Solution
19
Brodmann areas Brain areas based on
cytoarchitecture
Korbinian Brodmann (1868-1918)
(1906) - 52 primate cytoarchitectonic brain areas
(47 human)
20
- Phrenology
- (27 mind-skull correspondences)
- Impulse to propagation
- 2. Parental love
- 3. Fidelity
- 4. Valor
- 5. Carnivorousness
- 6. Sense of cunning
- 7. Sense of property
- 8. Love of authority
- 9. Vanity
- 10. Circumspection
- 11. Memory of facts
- 12. Sense of locality
- 13. Recollection of persons
- 14. Faculty for words
- 15. Faculty of language
- 16. Delight in colors
Franz Joseph Gall (1758-1828)
Associating variations in character with
craniological signs.
21
Revival of brain function localization theory,
1848
Railroad construction accident, Sep 13, 1848 in
Vermont
Frontal lobe damage impacts emotional regulation
22
Primary functions
23
LORETA Low resolution EEG tomographical array
Source Imaging
24
SKIL Brodmann Montage (55 areas out of 94
possible remainder are small and contribute
little to scalp EEG)
25
Based on 1,000 fMRI studies
26
(No Transcript)
27
Reduced right inhibition of motor system in ADHD
28
Peak frequency at each Brodmann area index of
maturation
adults posterior distribution
29
Graphical depictions of activity and
connectivityNumbers, spectral plots, line
graphs, brain maps
30
Spectral analysis of EEG, circa 1994
31
(No Transcript)
32
(No Transcript)
33
Autocoherence
- Ictal and inter-ictal for integer Hz bands (1-64
Hz)
34
Bimodulation Trimodulation
Moderate bimodulation of theta and alpha. Theta
magnitudes correlate well with alpha magnitude
but neither correlate highly with gamma
magnitudes across time. There is modest
trimodulation of these three frequencies
35
Bimodulation for seizure detection
36
Bispectral Cross-modulation
Cross-bimodulation of frontal theta and posterior
alpha magnitudes.
37
Rogue Site Analysis
- Anterior Callostomy
38
(No Transcript)
39
Spectral Entropy
- SE disorder in signal, its constituent
variability - Wide, flat distribution high SE
- Narrow, peaked low SE
- Nunes at el (2004) likened entropy to freedom of
choice "conscious cortex is free to move among a
huge number of available microstates." Entropy
indexes (log) number of possible microstate
rearrangements which can produce same macrostate.
- Low entropy low number of accessible
microstates.
40
Periodicity Table Chemistry - comparing cells
41
Focality Local vs Network measures
Degree that local activity dis/associates from
network
42
Complexity analysis
Recommended
