
Capital Budgeting Techniques PowerPoint PPT Presentation
Title: Capital Budgeting Techniques
1
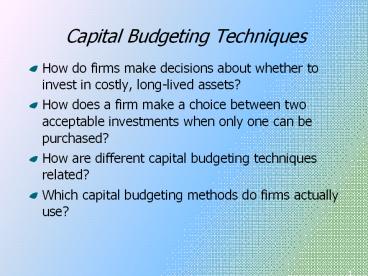
Capital Budgeting Techniques
- How do firms make decisions about whether to
invest in costly, long-lived assets? - How does a firm make a choice between two
acceptable investments when only one can be
purchased? - How are different capital budgeting techniques
related? - Which capital budgeting methods do firms actually
use?
2
Capital Budgeting
- Introduction to Capital Budgeting
- Payback Periodtraditional and discounted
- Net Present Value (NPV)
- Internal Rate of Return (IRR)
- Modified IRR
- Comparison of NPV and IRR
- NPV/IRR Ranking Conflicts/Cautions
3
Capital Budgeting
- Capital Budgeting Basics and Techniques
- rfirms required rate of return
- CFcash flows generated by an investment
- Capital Budgetingcash flows and risk
- rfirms required rate of return
- CFcash flows generated by an investment
4
Capital Budgeting Basics
- Importance of capital budgeting decisions
- long-term effectcapital, or long-term funds,
raised by the firms are used to invest in assets
that enable the firm to generate revenues several
years into the future. - timing of a decision is importantdecisions
impact the firm for several years. - Generating ideas for capital budgeting
- employees, customers, suppliers, and so forth
- based on needs and experiences of the firm and
these groups
5
Capital Budgeting Basics
- Project classificationsreplacement decisions
versus expansion decisions - replacement decisionintended to maintain
existing levels of operations - expansion decisiona decision concerning whether
the firm should expand operations - Project classificationsindependent projects
versus mutually exclusive projects - independent projectaccepting one independent
project does not affect the acceptance of any
other project - mutually exclusive projectsonly one project can
be purchased
6
Capital Budgeting BasicsCapital Budgeting
Versus Asset Valuation
- Value of an asset PV of the cash flows the
asset is expected to generate during its life
- An asset is an acceptable investment if the cost
of the asset is less than its value - Acceptable if PV of CFs gt Cost
7
Capital Budgeting Techniques
- Payback period
- Net present value
- Internal rate of return
8
Capital Budgeting TechniquesIllustrative
Investment
- 0 (7,000)
- 1 2,000
- 2 1,000
- 3 5,000
- 4 3,000
- r 15
9
Capital Budgeting Example Cash Flow Time Line
15
2,000
1,000
5,000
3,000
(7,000.00)
1,739.13
756.14
3,287.58
1,715.26
10
Capital Budgeting TechniquesPayback Period
- Number of years it takes to recapture the initial
investment.
Year Cash Flow Cumulative CF 0 (7,000) (7,00
0) 1 2,000 (5,000) 2 1,000
(4,000) 3 5,000 1,000 4 3,000 4,000
2ltPaybacklt3
11
Capital Budgeting TechniquesPayback Period
12
Capital Budgeting TechniquesPayback Period
- Accept the project if Payback, PB lt some number
of years established by the firm - PB 2.8 years is acceptable if the firm has
established a maximum payback of 4.0 years
13
Capital Budgeting TechniquesPayback Period
- Advantages
- Simple
- Cash flows are used
- Provides an indication of the liquidity of a
project - Disadvantages
- Does not use time value of money concepts
- Cash flows beyond the payback period are ignored
14
Capital Budgeting TechniquesPayback Period
Year Cash Flow Cumulative CF 0 (7,000) (7,00
0) 1 2,000 (5,000) 2 1,000
(4,000) 3 5,000 1,000 4 3,000 4,000
Year Cash Flow Cumulative CF 0 (7,000) (7,0
00) 1 2,000 (5,000) 2 1,000
(4,000) 3 5,000 1,000 4 3,000 4,000
5 1,000,000 1,004,000
PB 2.80 yrs
15
Capital BudgetingNet Present Value (NPV)
- NPV present value of future cash flows less the
initial investment
An investment is acceptable if NPV gt 0
16
Capital BudgetingNPV
NPV 498.11 gt 0, so the project is acceptable
17
Capital Budgeting Example Cash Flow Time Line
18
Capital BudgetingNPV
- Advantages
- Cash flows rather than profits are analyzed
- Recognizes the time value of money
- Acceptance criterion is consistent with the goal
of maximizing value - Disadvantage
- Detailed, accurate long-term forecasts are
required to evaluate a projects acceptance
19
Solving for NPV
- Numerical (equation) solution
- Financial Calculator solution
- Spreadsheet solution
20
Solving for NPVNumerical Solution
21
Solving for NPVFinancial Calculator Solution
- Input the following into the cash flow register
- CF0 -7,000
- CF1 2,000
- CF2 1,000
- CF3 5,000
- CF4 3,000
- Input I 15
- Compute NPV 498.12
22
Capital BudgetingDiscounted Payback Period
- Payback period computed using the present values
of the future cash flows.
Cumulative Year Cash Flow PV of CF _at_15 PV
of CF
0 (7,000) (7,000.00) (7,000.00) 1 2,000
1,739.13 (5,260.87) 2 1,000
756.14 (4,504.73) 3 5,000 3,287.58 (1,217.
14) 4 3,000 1,715.26 498.12
PBdisc 3.71
A project is acceptable if PBdisc lt projects
life
23
Capital BudgetingInternal Rate of Return (IRR)
- If NPVgt0, projects return gt r
- Example
- Initial investment 7,000.00
- PV of future cash flows 7,498.12
IRR gt 15
NPV 498.12 r 15
- If IRR projects rate of return
- IRR the rate of return that causes the NPV of
the project to equal zero, or where the present
value of the future cash flows equals the initial
investment.
24
Capital BudgetingInternal Rate of Return (IRR)
A project is acceptable if its IRR gt r
25
Capital BudgetingInternal Rate of Return (IRR)
26
Internal Rate of Return (IRR)Cash Flow Time Line
IRR ?
27
Capital BudgetingIRR
- Advantages
- Cash flows rather than profits are analyzed
- Recognizes the time value of money
- Acceptance criterion is consistent with the goal
of maximizing value - Disadvantages
- Detailed, accurate long-term forecasts are
required to evaluate a projects acceptance - Difficult to solve for IRR without a financial
calculator or spreadsheet
28
Solving for IRRNumerical Solution
Using the trial-and-error method plug in values
for IRR until the left and right side of the
following equation become equal.
29
Solving for IRRNumerical Solution
Rate of Return NPV 15 498.12 16 327.46
17 162.72 18 3.62 19 (150.08)
18ltIRRlt19
30
Solving for IRRFinancial Calculator Solution
- Input the following into the cash flow register
- CF0 -7,000
- CF1 2,000
- CF2 1,000
- CF3 5,000
- CF4 3,000
- Compute IRR 18.02
31
NPV versus IRR
- When NPV gt 0, a project is acceptable because the
firm will increase its value, which means the
firm earns a return greater than its required
rate of return (r) if it invests in the project. - When IRR gt r, a project is acceptable because the
firm will earn a return greater than its required
rate of return (r) if it invests in the project. - When NPV gt 0, IRR gt r for a projectthat is, if a
project is acceptable using NPV, it is also
acceptable using IRR.
32
Accept/Reject Decisions Using NPV, Discounted
Payback, and IRR
Technique Evaluation Result
Acceptable? NPV NPV gt 0 IRR IRR gt r Discounted
PB PBdisc lt projects life
YES YES YES
33
NPV Profile
- A graph that shows the NPVs of a project at
various required rates of return.
Rate of Return NPV 15 498.12 16 327.46
17 162.72 18 3.62 19 (150.08) 20 (298.61)
21 (442.20)
34
NPV Profile
IRR 18.02
35
Capital Budgeting TechniquesIllustrative
Projects A B
Project B
- 0 (7,000.00)
- 1 2,000.00
- 2 1,000.00
- 3 5,000.00
- 4 3,000.00
0 1 2,000.00 2 1,000.00 3 5,000.00 4
3,000.00 Trad PB 2.80 NPV
498.12 IRR 18.02
(8,000.00) 6,000.00 3,000.00 1,000.00 500.00
1.67 429.22 19.03
r 15
36
NPV Profiles for Projects A B
37
NPV ProfileProjects A B
38
Capital Budgeting TechniquesIllustrative
Projects A B
- 0 (7,000) (8,000)
- 1 2,000 6,000
- 2 1,000 3,000
- 3 5,000 1,000
- 4 3,000 500
1,000 (4,000) (2,000) 4,000 2,500
IRR of (CFA CFB) Cash Flow Stream 16.15 At r
16.15, NPVA NPVB 302.37
39
NPV/IRR Ranking Conflicts
Asset A Asset B Traditional PB 2.80 yrs 1.67
yrs Discounted PB 3.71 yrs 2.78
yrs NPV 498.12 429.22 IRR 18.02 19.03
Asset A Traditional PB 2.80 yrs Discounted
PB 3.71 yrs NPV 498.12 IRR 18.02
Asset A Asset B Traditional PB 2.80 yrs 1.67
yrs Discounted PB 3.71 yrs 2.78
yrs NPV 498.12 429.22 IRR 18.02 19.03
Which asset(s) should be purchased?
Asset A, because it has the higher NPV.
40
NPV/IRR Ranking Conflicts
- Ranking conflicts result from
- Cash flow timing differences
- Size differences
- Unequal lives
- Reinvestment rate assumptions
- NPVreinvest at the firms required rate of
return - IRRreinvest at the projects internal rate of
return, IRR
41
Multiple IRRs
- Conventional cash flow patterncash outflow(s)
occurs at the beginning of the projects life,
followed by a series of cash inflows. - Unconventional cash flow patterncash outflow(s)
occurs during the life of the project, after cash
inflows have been generated. - An IRR solution occurs when a cash flow pattern
is interrupted if a cash flow pattern is
interrupted more than once, then more than one
IRR solution exists.
42
Multiple IRRsExample
- Year Cash Flow
- 0 (15,000)
- 1 40,150
- 2 (13,210)
- 3 (16,495)
IRR1 22.5 IRR2 92.0
43
Modified Internal Rate of Return (MIRR)
- Generally solves the ranking conflict and the
multiple IRR problem
44
MIRRExample
Year Project A Project B 0 (7,000) (8,000) 1
2,000 6,000 2 1,000 3,000 3 5,000 1,000 4 3
,000 500
Discounted PB 3.71 yrs 2.78 yrs NPV 498.12 429.
22 IRR 18.02 19.03
44
45
MIRRExample
Year Project A Project B 0 (7,000) (8,000) 1
2,000 6,000 2 1,000 3,000 3 5,000 1,000 4 3
,000 500
Project Acalculator solution N 4, PV
-7,000, PMT 0, FV 13,114.25 I/Y 16.99
MIRRA
Project Acalculator solution N 4, PV
-7,000, PMT 0, FV 13,114.25 I/Y 16.99
MIRRA
Project Bcalculator solution N 4, PV
-8,000, PMT 0, FV 14,742.75 I/Y 16.51
MIRRB
45
46
Capital BudgetingThe Answers
- How do firms make decisions about whether to
invest in costly, long-lived assets? - Firms use decision-making methods that are based
on fundamental valuation concepts - How does a firm make a choice between two
acceptable investments when only one can be
purchased? - The decision should be consistent with the goal
of maximizing the value of the firm
47
Capital BudgetingThe Answers
- How are different capital budgeting techniques
related? - All techniques except traditional payback period
(PB) are based on time value of money - Which capital budgeting methods do firms actually
use? - Most firms rely heavily on NPV and IRR to make
investment decisions
Recommended
