
Rotational Spectra PowerPoint PPT Presentation
1 / 34
Title: Rotational Spectra
1
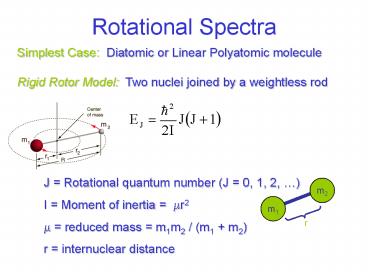
Rotational Spectra
Simplest Case Diatomic or Linear Polyatomic
molecule Rigid Rotor Model Two nuclei joined
by a weightless rod
- J Rotational quantum number (J 0, 1, 2, )
- I Moment of inertia mr2
- reduced mass m1m2 / (m1 m2)
- r internuclear distance
m2
m1
r
2
Rigid Rotor Model
In wavenumbers (cm-1)
Separation between adjacent levels F(J) F(J-1)
2BJ
3
Rotational Energy Levels
Selection Rules Molecule must have a permanent
dipole. DJ ?1
J. Michael Hollas, Modern Spectroscopy, John
Wiley Sons, New York, 1992.
4
Rotational Spectra
J ? J F(J)-F(J)
3 ? 4 2(1.91)(4) 15.3 cm-1
4 ? 5 2(1.91)(5) 19.1 cm-1
5 ? 6 2(1.91)(6) 22.9 cm-1
6 ? 7 2(1.91)(7) 26.7 cm-1
7 ? 8 2(1.91)(8) 30.6 cm-1
8 ? 9 2(1.91)(9) 34.4 cm-1
9 ? 10 2(1.91)(10) 38.2 cm-1
J. Michael Hollas, Modern Spectroscopy, John
Wiley Sons, New York, 1992.
5
Intensity of Transitions
T
cm-1
J. Michael Hollas, Modern Spectroscopy, John
Wiley Sons, New York, 1992.
6
Are you getting the concept?
Calculate the most intense line in the CO
rotational spectrum at room temperature and at
300 C. The rigid rotor rotational constant is
1.91 cm-1.
Recall k 1.38 x 10⁻²³ J/K h 6.626 x 10⁻³⁴
Js c 3.00 x 10⁸ m/s
7
The Non-Rigid Rotor
Account for the dynamic nature of the chemical
bond DJ 0, ?1
D is the centrifugal distortion constant (D is
large when a bond is easily stretched) Typical
ly, D lt 10-4B and B 0.1 10 cm-1
8
More Complicated Molecules
Still must have a permanent dipole DJ 0, ?1
K is a second rotational quantum number
accounting for rotation around a secondary axis A.
9
Vibrational Transitions
Simplest Case Diatomic Molecule
Harmonic Oscillator Model Two atoms connected
by a spring.
in Joules
in cm-1
v vibrational quantum number (v 0, 1, 2, ) n
classical vibrational frequency
k force constant (related to the bond order).
10
Vibrational Energy Levels
- Selection Rules
- Must have a change in dipole moment (for IR).
- 2) Dv ?1
J. Michael Hollas, Modern Spectroscopy, John
Wiley Sons, New York, 1992.
11
Anharmonicity
Selection Rules Dv ?1, ?2, ?3, Dv 2, 3,
are called overtones. Overtones are often weak
because anharmonicity at low v is small.
Ingle and Crouch, Spectrochemical Analysis
12
Rotation Vibration Transitions
The rotational selection rule during a
vibrational transition is
DJ ?1
Unless the molecule has an odd number of
electrons (e.g. NO).
Then, DJ 0, ?1
Bv signifies the dependence of B on vibrational
level
13
Rotation Vibration Transitions
If DJ -1 ? P Branch If DJ 0 ? Q
Branch If DJ 1 ? R Branch
Ingle and Crouch, Spectrochemical Analysis
14
Rotation Vibrational Spectra
Why are the intensities different?
J. Michael Hollas, Modern Spectroscopy, John
Wiley Sons, New York, 1992.
15
Are you getting the concept?
In an infrared absorption spectrum collected from
a mixture of HCl and DCl, there are eight
vibrational bands (with rotational structure)
centered at the values listed below. Identify
the cause (species and transition) for each band.
Band Location Species/Transition
2096 cm-1
2101 cm-1
2903 cm-1
2906 cm-1
4133 cm-1
4139 cm-1
5681 cm-1
5685 cm-1
Atomic masses H ? 1.0079 amu D ? 2.0136 amu 35Cl
? 34.9689 amu 37Cl ? 36.9659 amu
16
Raman Spectra
Selection Rule DJ 0, ?2
J. Michael Hollas, Modern Spectroscopy, John
Wiley Sons, New York, 1992.
17
Polyatomics
If linear ? (3N 5) vibrational modes
(N is the of atoms) If non-linear ? (3N 6)
vibrational modes
Only those that have a change in dipole moment
are seen in IR.
http//jchemed.chem.wisc.edu/JCEWWW/Articles/WWW00
01/index.html
18
Linear Polyatomic
How many vibrational bands do we expect to see?
J. Michael Hollas, Modern Spectroscopy, John
Wiley Sons, New York, 1992.
19
Nonlinear Polyatomic (Ethylene)
J. Michael Hollas, Modern Spectroscopy, John
Wiley Sons, New York, 1992.
20
Infrared Spectroscopy
- Near Infrared 770 to 2500 nm
- 12,900 to 4000 cm-1
- Mid Infrared 2500 to 50,000 nm (2.5 to 50 mm)
- 4000 to 200 cm-1
- Far Infrared 50 to 1000 mm
- 200 to 10 cm-1
21
Infrared Spectroscopy Vibrational Modes
Ingle and Crouch, Spectrochemical Analysis
22
Group Frequencies
Estimate band location
Pretsch/Buhlmann/Affolter/ Badertscher, Structure
Determination of Organic Compounds
23
Are you getting the concept?
Estimate the stretching vibrational frequency for
a carbonyl group with a force constant, k, of 12
N/cm. If a CS bond had the same force constant,
where would its stretching band appear in the
infrared absorption spectrum?
Recall 1 amu 1.6605 x 10⁻²⁷ kg 1N 1
kgms-2 Atomic masses C ? 12.000 amu O ?
15.995 amu S ? 31.972 amu
24
Infrared Spectroscopy
- Near Infrared 770 to 2500 nm
- 12,900 to 4000 cm-1
- Overtones
- Combination tones
- Useful for quantitative measurements
- Mid Infrared 2500 to 50,000 nm (2.5 to 50 um)
- 4000 to 200 cm-1
- Fundamental vibrations
- Fingerprint region 1300 to 400 cm-1
- (characteristic for molecule as a whole)
- Far Infrared 2.5 to 1000 um
- 200 to 10 cm-1
- Fundamental vibrations of bonds with heavy
- atoms (useful, e.g., for organometallics)
25
Example of an Overtone
- Wagging vibration at 920 cm-1.
- Overtone at approximately 2 x 920 cm-1 1840
cm-1.
26
Fermi Resonance
N.B. Colthup et al., Introduction to Infrared and
Raman Spectroscopy, Academic Press, Boston, 1990.
27
Example of a Fermi Resonance
- Stretching vibration of C-C(O) at 875 cm-1.
- Overtone at approximately 2 x 875 cm-1 1750
cm-1 - coincides with CO stretch
28
Light Source Globar
Silicon Carbide Rod (5mm diameter, 50 mm
long) Heated electrically to 1300 1500
K Positive temperature coefficient of
resistance Electrical contact must be water
cooled to prevent arcing
Ingle and Crouch, Spectrochemical Analysis
29
Sample Preparation for IR Spectroscopy
Ingle and Crouch, Spectrochemical Analysis
30
Liquid Samples Cell Thickness
Ingle and Crouch, Spectrochemical Analysis
31
Window and Cell Materials
Ingle and Crouch, Spectrochemical Analysis
32
Solvents
Pretsch/Buhlmann/Affolter/Badertscher, Structure
Determination of Organic Compounds
33
Suspension Media for Solid Samples
Pretsch/Buhlmann/Affolter/Badertscher, Structure
Determination of Organic Compounds
34
Interferences
Pretsch/Buhlmann/Affolter/ Badertscher, Structure
Determination of Organic Compounds
Recommended
