
Solar Space Missions PowerPoint PPT Presentation
Title: Solar Space Missions
1
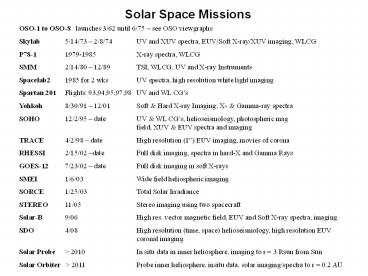
Solar Space Missions
OSO-1 to OSO-8 launches 3/62 until 6/75 see
OSO viewgraphs Skylab 5/14/73 2/8/74 UV and XUV
spectra, EUV/Soft X-ray/XUV imaging,
WLCG P78-1 1979-1985 X-ray spectra,
WLCG SMM 2/14/80 12/89 TSI, WLCG, UV and X-ray
Instruments Spacelab2 1985 for 2 wks UV spectra,
high resolution white light imaging Spartan
201 Flights 93,94,95,97,98 UV and WL
CGs Yohkoh 8/30/91 12/01 Soft Hard X-ray
Imaging X- Gamma-ray spectra SOHO 12/2/95
date UV WL CGs, helioseismology, photospheric
mag field, XUV EUV spectra and
imaging TRACE 4/2/98 date High resolution (1)
EUV imaging, movies of corona RHESSI 2/15/02
date Full disk imaging, spectra in hard-X and
Gamma Rays GOES-12 7/23/02 date Full disk
imaging in soft X-rays SMEI 1/6/03 Wide field
heliospheric imaging SORCE 1/25/03 Total Solar
Irradiance STEREO 11/05 Stereo imaging using two
spacecraft Solar-B 9/06 High res. vector magnetic
field, EUV and Soft X-ray spectra, imaging
SDO 4/08 High resolution (time, space)
helioseismology, high resolution EUV coronal
imaging Solar Probe gt 2010 In situ data in inner
heliosphere, imaging to r 3 Rsun from Sun Solar
Orbiter gt 2011 Probe inner heliosphere, insitu
data, solar imaging/spectra to r 0.2 AU
2
ORBITING SOLAR OBSERVATORIES (OSOs)
- OSOs were the first stabilized space platforms
for solar-oriented scientific instruments. - OSOs studied the Sun, flares, and other solar
activity at X-ray, gamma and ultraviolet
wavelengths. Some OSOs acquired spectra, others
spectra and images (typical resolution 30 arc
sec to 1 arc min) - The lower spinning (30 rpm) wheel section acted
as a gyroscope to stabilize the spacecraft. The
upper fan-shaped section, the "sail," remained
pointed toward the sun during OSO daytime. - Experiments in the wheel scanned the sun every 2
sec those in the sail pointed continuously at
the sun. - The OSOs were orbited about 565 km above earth
by Delta rockets and circled the earth every 96
minutes. Each OSO carried up to 9 experiments
3
OSO Chronology
- OSO 1 launched March 7, 1962 Mass 208 kg.
- OSO 2 launched February 3, 1965 Mass 247 kg.
Harvard EUV spectrometer/ spectroheliograph HV
failure not uncommon in early days - OSO C launched August 25, 1965 Mass 280 kg
Launch Failure. - OSO 3 launched March 8, 1967 Mass 281 kg
- OSO 4 launched Oct. 15, 1967 Mass 272 kg.
Harvard Instrument EUV imaging, spectra, first
model of CHs -- 1 arc min spatial resolution - OSO 5 launched Jan. 22, 1969 Mass 291 kg.
- OSO 6 launched August 9,1969 Mass 290 kg.
Harvard Instrument 35 arc sec resolution - OSO 7 launched Sept. 29, 1971 Mass 635 kg.
- OSO 8 launched June 21, 1975 Mass 1,066 kg.
Demonstrated corona not heated by sound waves.
4
Skylab Mission Skylab 1 Launch of Skylab via
unmanned Saturn V rocket Skylab 2 1st astronaut
crew, fixed solar panel, installed sun screen, 1
month mission, solar film recovered
returned Skylab 3 2nd crew, extensive solar data,
film returned, 2 month mission Skylab 4 3rd
astronaut crew, extensive solar data, comet data,
3 month mission
5
(No Transcript)
6
(No Transcript)
7
Skylab Apollo Telescope Mount Instrumentation SO52
White Light Coronagraph (HAO) Film SO54 Soft
X-ray Telescope (ASE) Film SO55 EUV
Telescope Spectrometer (Harvard) Electronic SO56
Soft X-ray Telescope (MSFC) Film SO82A XUV
Spectrometer/imager (NRL) Film SO82B UV
Spectrometer (NRL) Film H-alpha
Telescope (pointing telescope - Harvard) Film
Some results Skylab coronagraphic photos show
how frequent (several times/day) and spectacular
CMEs are little known about CMEs prior to
Skylab. Long-term observations in soft x-rays
show evolution of active regions, CHs, coronal
bright points revolutionizing perceptions about
coronal structure loop structure. High
resolution (few arc sec) EUV, XUV, and Soft X-ray
images and spectra (UV, EUV, XUV) provide wealth
of data for modeling chromosphere, transition
region, and corona. Excellent multi-wavelength
(UV to Soft X-rays) data on flares, leading to
major improvements in understanding of these
events. CH and CME data s lead result in much
improved understanding of connection between
solar features/events and solar wind.
8
SO82 A Photo of December 1973 Solar Eruption In
He II l304
9
Start of Skylab road race
Owen Garriott at ATM Control Panel -- Skylab-3
Ed Gibson at ATM Control Panel -- Skylab-4
ATM -- like playing 3 pianos at same time
Alan Bean doing gymnastics -- Skylab 2 Bean
also flew on Apollo 12, 4th man to walk on moon.
10
Solar Maximum Mission December 14, 1980
December, 1989
11
SMM carried a battery of instruments designed to
study solar flares and the active solar
atmosphere
- Coronagraph/Polarimeter (CP)
- White light coronagraph to detect and observe
CMEs and study coronal evolution. - Ultraviolet Spectrometer and Polarimeter (UVSP)
- Wavelength Range 1170 - 1800 Å in 2nd order up
to 3600 Å in 1st order. Gregorian telescope
2" resolution, Ebert-Fastie spectrometer, with 5
photomultiplier detectors. Telescope secondary
could be rastered to make image of area up to
256" x 256". Slit wheel gave entrance apertures
ranged in size from 1" x 1" to 125" x 286", and
the exit slits ranged from 0.01 to 3.0 Å in
second order. Several of the exit slits biescted
by beamsplitter prisms to direct the short- and
long-wavelength sides of a line profile to
different detectors to allow velocity imaging
("Dopplergrams"). A polarimeter could be
inserted behind the exit aperture. - Soft X-Ray Polychromator (XRP)
- Hard X-Ray Burst Spectrometer (HXRBS)
- Energy Range 25 - 500 keV in 15 channels, 128ms
time resolution. Designed to examine the role of
energetic electrons in solar flares by measuring
the variations in intensity and energy of the
hard X-ray fluxes. - Hard X-ray Imaging Spectrometer (HXIS)
- Gamma Ray Spectrometer (GRS)
- Energy Range 10 - 140 MeV for Gamma Rays and
neutrons above 20 MeV, and 10 - 140 keV for hard
X-rays. Also measured 7 nuclear lines between
0.3 and 0.9 Mev. - Active Cavity Radiometer Irradiance Monitor
(ACRIM) - Measured total solar irradiance (primarily white
light) - SMM payload originally had XUV
spectrometer/spectroheliometer, but development
terminated due to cost/development problems.
12
SMM Coronagraph/Polarimeter
13
SMM White Light Coronagraph Images of Two Events
14
Total Solar Irradiance Shows solar cycle
variation of 0.1, and competing effects of
sunspots (low values of) and plages (high values)
15
SMM was rescued and repaired in a 1984 Space
Shuttle Challenger mission.
Astronaut in maneuvering unit
16
- Yohkoh (Sunbeam) was launched August 30, 1991
and obtained data until December 2001. The
scientific objective was to observe the energetic
phenomena taking place on the Sun, specifically
solar flares in x-ray and gamma-ray emissions. - Instruments
- Bragg Crystal Spectrometer (BCS) US and GB
- Wide Band Spectrometer (WBS) Japan
- Soft X-Ray Telescope (SXT) U.S.
- Hard X-Ray Telescope (HXT). Japan
- BCS has four bent crystal spectrometers. Each is
designed to observe a limited range of soft x-ray
wavelengths containing spectral lines that are
particularly sensitive to the hot plasma produced
during a flare. The observations of these
spectral lines provide information about the
temperature and density of the hot plasma, and
about motions of the plasma perpendicular to the
line of sight. Time resolution one second. - WBS has three detectors a soft x-ray, a hard
x-ray, and a gamma-ray spectrometer. They provide
spectra from soft x-rays to gamma rays with a
time resolution on the order of one sec. Like the
BCS, images are not obtained. - SXT images x-rays in the 0.25 - 4.0 keV range. It
uses thin metallic filters to acquire images in
restricted portions of this energy range. SXT can
resolve features down to 2.5 arc sec in size.
Information about the temperature and density of
the plasma emitting the observed x-rays is
obtained by comparing images acquired with the
different filters. Flare images can be obtained
every 2 seconds. Smaller images with a single
filter can be obtained as frequently as once
every 0.5 seconds. - HXT observes hard x-rays in four energy bands
through sixty-four pairs of grids. These grid
pairs provide information about 32 spatial scales
of the x-ray emission. This information is
combined on the ground to construct an image of
the source in each of the four energy bands.
Structures with angular sizes down to about 5 arc
seconds can be resolved. These images can be
obtained as frequently as once every 0.5 seconds.
17
Yohkoh
Spacecraft
Soft X-ray Telescope
SXT is a glancing incidence telescope of 1.54 m
focal length which forms X-ray images in the 0.25
to 4.0 keV range on a 1024x1024 CCD detector. A
selection of thin metallic filters located near
the focal plane provides the capability to
separate the different X-ray energies for plasma
temperature diagnostics. A companion visible
light telescope provides knowledge of the
location of X-ray images with respect to features
observable in visible light.
18
Yohkoh Hard X-Ray Telescope (HXT)
HXT is a Fourier synthesis type imager with 64
bi-grid modulation subcollimators (SC's). Each
SC has a different pitch and/or a position angle
of collimator grids, together with a NaI (Tl)
scintillation crystal and a detector
photomultiplier located behind the SC. The
number of hard X-ray photons passing through a
single SC is periodically modulated with respect
to the incident angle, which gives a modulation
pattern of the corresponding SC, and count rate
data obtained by each detector which can be
regarded as a spatial Fourier component ( DC
level) of a hard X-ray image. When a flare-mode
is triggered, a set of 64 hard X-ray count rate
data is accumulated every 0.5 s ( the highest
temporal resolution) in four energy bands between
14 and 93 keV (L, M1, M2, and H bands,
respectively) and is transferred from HXT to the
Data Processor (DP). From these data hard X-ray
images can be synthesized using image restoration
procedures such as the Maximum Entropy Method
(MEM). Field-of-view (FOV) of HXT is about 35 by
35 arcminutes (whole Sun) allowing flares
anywhere on Sun to be imaged.
19
Yohkoh Soft X-ray Image
20
Yohkoh Soft X-ray Image Ground-based White
Light Image
Back
Page Created by Ryan McWilliams and Piet
Martens
21
Yohkoh Soft X-ray Images from Solar Maximum to
Solar Minimum
22
Solar Science Report Yohkoh
Yohkoh observes two sigmoids
- SXT observed two so-called sigmoidal active
regions at similar longitudes north and south of
the equator on May 27, 1999 indicated by the
arrows in the figure. - Sigmoidal regions are dominated by S shaped
magnetic loops containing hot plasma. The S
shape is indicative of a twisted magnetic field
carrying magnetic free energy capable of powering
an eruption.
- A major Yohkoh discovery is that sigmoidal
regions tend to launch CMEs. - Both of the above regions erupted, confirming the
importance of the sigmoidal structures.
23
S Marks the Spot
Prior to Coronal Mass Ejection
After Coronal Mass Ejection
24
Yohkoh Hard X-Ray Image Light Curve of Flare,
25
Yohkoh WBS Spectrum
Recommended
