
Statistics 202: Statistical Aspects of Data Mining PowerPoint PPT Presentation
Title: Statistics 202: Statistical Aspects of Data Mining
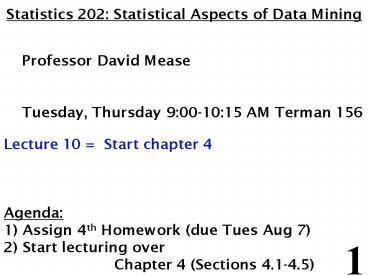
1
Statistics 202 Statistical Aspects of Data
Mining Professor David Mease
Tuesday, Thursday 900-1015 AM Terman
156 Lecture 10 Start chapter 4 Agenda 1)
Assign 4th Homework (due Tues Aug 7) 2) Start
lecturing over Chapter 4 (Sections
4.1-4.5)
2
- Homework Assignment
- Chapter 4 Homework and Chapter 5 Homework Part 1
is due Tuesday 8/7 - Either email to me (dmease_at_stanford.edu), bring
it to class, or put it under my office door. - SCPD students may use email or fax or mail.
- The assignment is posted at
- http//www.stats202.com/homework.html
- Important If using email, please submit only a
single file (word or pdf) with your name and
chapters in the file name. Also, include your
name on the first page. Finally, please put your
name and the homework in the subject
of the email.
3
Introduction to Data Mining by Tan, Steinbach,
Kumar Chapter 4 Classification Basic
Concepts, Decision Trees, and Model Evaluation
4
- Illustration of the Classification Task
Learning Algorithm
Model
5
- Classification Definition
- Given a collection of records (training set)
- Each record contains a set of attributes (x),
with one additional attribute which is the class
(y). - Find a model to predict the class as a function
of the values of other attributes. - Goal previously unseen records should be
assigned a class as accurately as possible. - A test set is used to determine the accuracy of
the model. Usually, the given data set is divided
into training and test sets, with training set
used to build the model and test set used to
validate it.
6
- Classification Examples
- Classifying credit card transactions as
legitimate or fraudulent - Classifying secondary structures of protein as
alpha-helix, beta-sheet, or random coil - Categorizing news stories as finance, weather,
entertainment, sports, etc - Predicting tumor cells as benign
or malignant
7
- Classification Techniques
- There are many techniques/algorithms for
carrying out classification - In this chapter we will study only decision
trees - In Chapter 5 we will study other techniques,
including some very modern and effective
techniques
8
- An Example of a Decision Tree
Splitting Attributes
Refund
Yes
No
MarSt
NO
Married
Single, Divorced
TaxInc
NO
lt 80K
gt 80K
YES
NO
Model Decision Tree
Training Data
9
Applying the Tree Model to Predict the Class for
a New Observation
Test Data
Start from the root of tree.
10
Applying the Tree Model to Predict the Class for
a New Observation
Test Data
11
Applying the Tree Model to Predict the Class for
a New Observation
Test Data
Refund
Yes
No
MarSt
NO
Married
Single, Divorced
TaxInc
NO
lt 80K
gt 80K
YES
NO
12
Applying the Tree Model to Predict the Class for
a New Observation
Test Data
Refund
Yes
No
MarSt
NO
Married
Single, Divorced
TaxInc
NO
lt 80K
gt 80K
YES
NO
13
Applying the Tree Model to Predict the Class for
a New Observation
Test Data
Refund
Yes
No
MarSt
NO
Married
Single, Divorced
TaxInc
NO
lt 80K
gt 80K
YES
NO
14
Applying the Tree Model to Predict the Class for
a New Observation
Test Data
Refund
Yes
No
MarSt
NO
Assign Cheat to No
Married
Single, Divorced
TaxInc
NO
lt 80K
gt 80K
YES
NO
15
- Decision Trees in R
- The function rpart() in the library rpart
generates decision trees in R. - Be careful This function also does regression
trees which are for a numeric response. Make
sure the function rpart() knows your class labels
are a factor and not a numeric response. - (if y is a factor then method"class" is
assumed)
16
In class exercise 32 Below is output from the
rpart() function. Use this tree to predict the
class of the following observations a)
(Agemiddle Number5 Start10) b) (Ageyoung
Number2 Start17) c) (Ageold Number10
Start6) 1) root 81 17 absent (0.79012346
0.20987654) 2) Startgt8.5 62 6 absent
(0.90322581 0.09677419) 4) Ageold,young
48 2 absent (0.95833333 0.04166667) 8)
Startgt13.5 25 0 absent (1.00000000 0.00000000)
9) Startlt 13.5 23 2 absent (0.91304348
0.08695652) 5) Agemiddle 14 4 absent
(0.71428571 0.28571429) 10) Startgt12.5
10 1 absent (0.90000000 0.10000000) 11)
Startlt 12.5 4 1 present (0.25000000 0.75000000)
3) Startlt 8.5 19 8 present (0.42105263
0.57894737) 6) Startlt 4 10 4 absent
(0.60000000 0.40000000) 12) Numberlt 2.5 1
0 absent (1.00000000 0.00000000) 13)
Numbergt2.5 9 4 absent (0.55555556 0.44444444)
7) Startgt4 9 2 present (0.22222222
0.77777778) 14) Numberlt 3.5 2 0 absent
(1.00000000 0.00000000) 15) Numbergt3.5 7
0 present (0.00000000 1.00000000)
17
In class exercise 33 Use rpart() in R to fit a
decision tree to last column of the sonar
training data at http//www-stat.wharton.upenn.e
du/dmease/sonar_train.csv Use all the default
values. Compute the misclassification error on
the training data and also on the test data
at http//www-stat.wharton.upenn.edu/dmease/sonar
_test.csv
18
In class exercise 33 Use rpart() in R to fit a
decision tree to last column of the sonar
training data at http//www-stat.wharton.upenn.e
du/dmease/sonar_train.csv Use all the default
values. Compute the misclassification error on
the training data and also on the test data
at http//www-stat.wharton.upenn.edu/dmease/sonar
_test.csv Solution install.packages("rpart") l
ibrary(rpart) trainlt-read.csv("sonar_train.csv",he
aderFALSE) ylt-as.factor(train,61) xlt-train,16
0 fitlt-rpart(y.,x) sum(ypredict(fit,x,type"cl
ass"))/length(y)
19
In class exercise 33 Use rpart() in R to fit a
decision tree to last column of the sonar
training data at http//www-stat.wharton.upenn.e
du/dmease/sonar_train.csv Use all the default
values. Compute the misclassification error on
the training data and also on the test data
at http//www-stat.wharton.upenn.edu/dmease/sonar
_test.csv Solution (continued) testlt-read.csv(
"sonar_test.csv",headerFALSE) y_testlt-as.factor(t
est,61) x_testlt-test,160 sum(y_testpredict(
fit,x_test,type"class"))/ length(y_test)
20
In class exercise 34 Repeat the previous
exercise for a tree of depth 1 by using
controlrpart.control(maxdepth1). Which model
seems better?
21
In class exercise 34 Repeat the previous
exercise for a tree of depth 1 by using
controlrpart.control(maxdepth1). Which model
seems better? Solution fitlt-
rpart(y.,x,controlrpart.control(maxdepth1)) s
um(ypredict(fit,x,type"class"))/length(y) sum(y
_testpredict(fit,x_test,type"class"))/ length(y
_test)
22
In class exercise 35 Repeat the previous
exercise for a tree of depth 6 by using
controlrpart.control(minsplit0,minbucket0,
cp-1,maxcompete0, maxsurrogate0,
usesurrogate0, xval0,maxdepth6) Which model
seems better?
23
In class exercise 35 Repeat the previous
exercise for a tree of depth 6 by using
controlrpart.control(minsplit0,minbucket0,
cp-1,maxcompete0, maxsurrogate0,
usesurrogate0, xval0,maxdepth6) Which model
seems better? Solution fitlt-rpart(y.,x, cont
rolrpart.control(minsplit0, minbucket0,cp-1,
maxcompete0, maxsurrogate0, usesurrogate0,
xval0,maxdepth6)) sum(ypredict(fit,x,type"
class"))/length(y) sum(y_testpredict(fit,x_test,
type"class"))/ length(y_test)
24
- How are Decision Trees Generated?
- Many algorithms use a version of a top-down or
divide-and-conquer approach known as Hunts
Algorithm (Page 152) - Let Dt be the set of training records that reach
a node t - If Dt contains records that belong the same class
yt, then t is a leaf node labeled as yt - If Dt contains records that belong to more than
one class, use an attribute test to split the
data into smaller subsets. Recursively apply the
procedure to each subset.
25
- An Example of Hunts Algorithm
Dont Cheat
26
- How to Apply Hunts Algorithm
- Usually it is done in a greedy fashion.
- Greedy means that the optimal split is chosen
at each stage according to some criterion. - This may not be optimal at the end even for the
same criterion, as you will see in your homework.
- However, the greedy approach is computational
efficient so it is popular.
27
- How to Apply Hunts Algorithm (continued)
- Using the greedy approach we still have to
decide 3 things - 1) What attribute test conditions to consider
- 2) What criterion to use to select the best
split - 3) When to stop splitting
- For 1 we will consider only binary splits for
both numeric and categorical predictors as
discussed on the next slide - For 2 we will consider misclassification error,
Gini index and entropy - 3 is a subtle business involving model
selection. It is tricky because we dont want to
overfit or underfit.
28
- 1) What Attribute Test Conditions to Consider
(Section 4.3.3, Page 155) - We will consider only binary splits for both
numeric and categorical predictors as discussed,
but your book talks about multiway splits also - Nominal
- Ordinal like nominal but dont break order
with split - Numeric often use midpoints between numbers
OR
Taxable Income gt 80K?
Yes
No
29
- 2) What criterion to use to select the best
split (Section 4.3.4, Page 158) - We will consider misclassification error, Gini
index and entropy - Misclassification Error
- Gini Index
- Entropy
30
- Misclassification Error
- Misclassification error is usually our final
metric which we want to minimize on the test set,
so there is a logical argument for using it as
the split criterion - It is simply the fraction of total cases
misclassified - 1 - Misclassification error Accuracy (page
149)
31
In class exercise 36 This is textbook question
7 part (a) on page 201.
32
- Gini Index
- This is commonly used in many algorithms like
CART and the rpart() function in R - After the Gini index is computed in each node,
the overall value of the Gini index is computed
as the weighted average of the Gini index in each
node
33
- Gini Examples for a Single Node
P(C1) 0/6 0 P(C2) 6/6 1 Gini 1
P(C1)2 P(C2)2 1 0 1 0
P(C1) 1/6 P(C2) 5/6 Gini 1
(1/6)2 (5/6)2 0.278
P(C1) 2/6 P(C2) 4/6 Gini 1
(2/6)2 (4/6)2 0.444
34
In class exercise 37 This is textbook question
3 part (f) on page 200.
35
- Misclassification Error Vs. Gini Index
- The Gini index decreases from .42 to .343 while
the misclassification error stays at 30. This
illustrates why we often want to use a surrogate
loss function like the Gini index even if we
really only care about misclassification.
A?
Gini(N1) 1 (3/3)2 (0/3)2 0
Gini(N2) 1 (4/7)2 (3/7)2 0.490
Yes
No
Node N1
Node N2
Gini(Children) 3/10 0 7/10 0.49 0.343
36
- Entropy
- Measures purity similar to Gini
- Used in C4.5
- After the entropy is computed in each node, the
overall value of the entropy is computed as the
weighted average of the entropy in each node as
with the Gini index - The decrease in Entropy is called information
gain (page 160)
37
- Entropy Examples for a Single Node
P(C1) 0/6 0 P(C2) 6/6 1 Entropy 0
log 0 1 log 1 0 0 0
P(C1) 1/6 P(C2) 5/6 Entropy
(1/6) log2 (1/6) (5/6) log2 (1/6) 0.65
P(C1) 2/6 P(C2) 4/6 Entropy
(2/6) log2 (2/6) (4/6) log2 (4/6) 0.92
38
In class exercise 38 This is textbook question
5 part (a) on page 200.
39
In class exercise 39 This is textbook question
3 part (c) on page 199. It is part of your
homework so we will not do all of it in
class.
40
- A Graphical Comparison
Recommended
