
Supplementary Figure 1 PowerPoint PPT Presentation
1 / 6
Title: Supplementary Figure 1
1
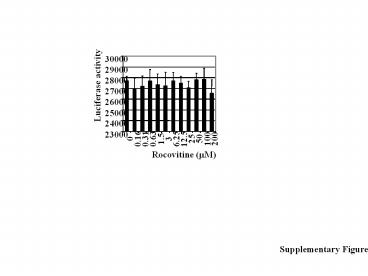
Supplementary Figure 1
2
A)
Clone A
Clone B
120
120
120
120
120
120
120
120
100
100
100
100
100
100
100
100
80
80
80
80
80
80
80
80
60
60
60
60
60
60
60
60
40
40
40
40
40
40
40
40
20
20
20
20
20
20
20
20
0
0
0
0
0
0
0
0
Vector
Vector
WT
S393A
WT
S393A
Supplementary Figure 2
3
B)
32P E1
C)
aa 388-402
aa 516-530
32P E1
CDK1 /CycB
Supplementary Figure 3
4
Supplementary Figure 4
5
E1 WT
Con
B)
-
ROSC(10mM)
-
NUC
CYT
Supplementary Figure 5
6
A)
B)
EBNA1
EBNA1 S393
WT
S393A
naked oriP
oriP in cell
ROCO (20uM)
-
-
-
-
.1
.5 ng
ROSC (10mM)
11
4
4
11
Day
oriP episome
Loading
Day 21 in Puro
100
114
73
64
100
428
Day
D)
18
16
14
12
Cell No. (x109)
10
8
6
4
2
Supplementary Figure 6
0
0
4
7
10
13
14
16
19
21
Days in culture in Puro
Recommended
