
WT PowerPoint PPT Presentation
1 / 1
Title: WT
1
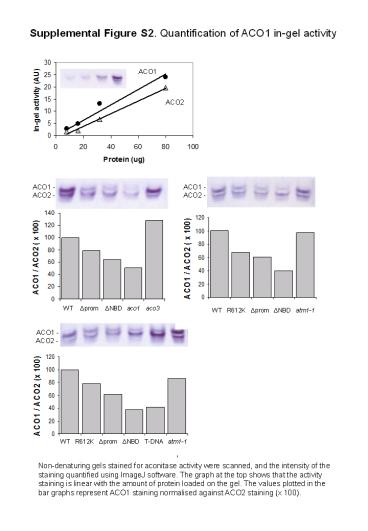
Supplemental Figure S2. Quantification of ACO1
in-gel activity
ACO1 -
ACO1 -
ACO2 -
ACO2 -
WT
?prom
?NBD
aco1
aco3
R612K
atm1-1
WT
?prom
?NBD
ACO1 -
ACO2 -
R612K
WT
?prom
?NBD
T-DNA
atm1-1
Non-denaturing gels stained for aconitase
activity were scanned, and the intensity of the
staining quantified using ImageJ software. The
graph at the top shows that the activity staining
is linear with the amount of protein loaded on
the gel. The values plotted in the bar graphs
represent ACO1 staining normalised against ACO2
staining (x 100).
Recommended
