
System type, steady state tracking, PowerPoint PPT Presentation
Title: System type, steady state tracking,
1
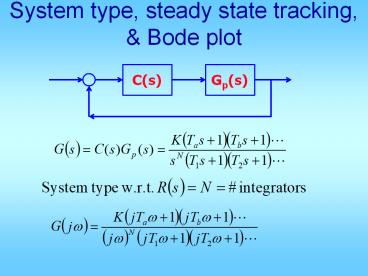
System type, steady state tracking, Bode plot
C(s)
Gp(s)
2
As ? ? 0 Therefore gain plot slope 20N
dB/dec. phase plot value 90N deg
3
If Bode gain plot is flat at low freq, system is
type zero Confirmed by phase plot flat and ?
0 at low freq Then Kv 0, Ka 0 Kp
Bode gain as ??0 DC gain (convert dB to
values)
4
Example
5
Steady state tracking error
Suppose the closed-loop system is stable If the
input signal is a step, ess would be
If the input signal is a ramp, ess
would be If the input signal is a unit
acceleration, ess would be
6
N 1, type 1 Bode mag. plot has 20 dB/dec
slope at low freq. (??0) (straight line with
slope 20) Bode phase plot becomes flat at
90 when ??0 Kp DC gain ? 8 Kv K value of
asymptotic straight line at ? 1 ws0dB
asymptotic straight lines 0 dB crossing
frequency Ka 0
7
Example
Asymptotic straight line
8
The matching phase plot at lowfreq. must be ?
90 type 1 Kp 8 ? position error
const. Kv value of low freq. straight line
at ? 1 23 dB 14 ? velocity error
const. Ka 0 ? acc. error const.
9
Steady state tracking error
Suppose the closed-loop system is stable If the
input signal is a step, ess would be
If the input signal is a ramp, ess
would be If the input signal is a unit
acceleration, ess would be
10
N 2, type 2 Bode gain plot has 40
dB/dec slope at low freq. Bode phase plot
becomes flat at 180 at low freq. Kp DC
gain ? 8 Kv 8 also Ka value of straight
line at ? 1 ws0dB2
11
Example
Ka
Sqrt(Ka)
How should the phase plot look like?
12
(No Transcript)
13
Steady state tracking error
Suppose the closed-loop system is stable If the
input signal is a step, ess would be
If the input signal is a ramp, ess
would be If the input signal is a unit
acceleration, ess would be
14
System type, steady state tracking, Nyquist plot
C(s)
Gp(s)
As ? ? 0
15
Type 0 system, N0
Kplims?0 G(s) G(0)K
Kp
w?0
G(jw)
16
Type 1 system, N1
Kvlims?0 sG(s) cannot be determined easily from
Nyquist plot
w?infinity
w?0
G(jw) ? -j8
17
Type 2 system, N2
Kalims?0 s2G(s) cannot be determined easily from
Nyquist plot
w?infinity
w?0
G(jw) ? -8
18
- Margins on Bode plots
- In most cases, stability of this closed-loop
- can be determined from the Bode plot of G
- Phase margin gt 0
- Gain margin gt 0
G(s)
19
(No Transcript)
20
(No Transcript)
21
If never cross 0 dB line (always
below 0 dB line), then PM 8. If
never cross 180 line (always above 180), then
GM 8. If cross 180 several
times, then there are several GMs. If
cross 0 dB several times, then there are
several PMs.
22
Example Bode plot on next page.
23
(No Transcript)
24
Example Bode plot on next page.
25
(No Transcript)
26
- Where does cross the 180
lineAnswer __________at ?pc, how much is - Closed-loop stability __________
27
(No Transcript)
28
- crosses 0 dB at __________at
this freq, - Does cross 180 line? ________
- Closed-loop stability __________
29
Margins on Nyquist plot
- Suppose
- Draw Nyquist plot G(j?) unit circle
- They intersect at point A
- Nyquist plot cross neg. real axis at k
30
(No Transcript)
31
(No Transcript)
Recommended
