
NOAA UAV De\ PowerPoint PPT Presentation
Title: NOAA UAV De\
1
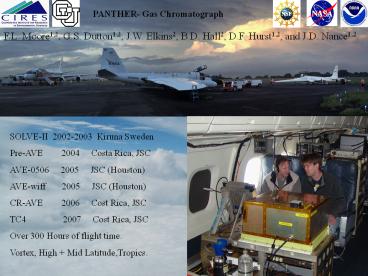
PANTHER- Gas Chromatograph
F.L. Moore1,2, G.S. Dutton1,2, J.W. Elkins2, B.D.
Hall2, D.F. Hurst1,2, and J.D. Nance1,2.
Can Measure 18 trace gas species every 1 to 3
min.
SOLVE-II 2002-2003 Kiruna Sweden Pre-AVE
2004 Costa Rica, JSC AVE-0506 2005
JSC (Houston) AVE-wiff 2005 JSC
(Houston) CR-AVE 2006 Cost Rica,
JSC TC4 2007 Cost Rica,
JSC Over 300 Hours of flight time. Vortex, High
Mid Latitude,Tropics.
2
PAN and other Trace Hydrohalocarbon ExpeRiment
(PANTHER)
6-Channel GC (gas chromatograph). 3 ECD
(electron capture detectors), packed columns
(OV-101, Porpak-Q, molecular sieve). 1 ECD
with a TE (thermal electric) cooled RTX-200
capillary column. 2-channel MSD (mass
selective detector). The MSD analyses two
independent samples concentrated onto TE
cooled Haysep traps, then passed through two
temperature programmed RTX-624
capillary columns.
Compounds Measured on Past Missions ECD
channels N2O, SF6, CCl2F2 (CFC-12),) CCl3F
(CFC-11), and CBrClF2 (halon-1211), H2, CH4, CO,
CCl4, CH3CCl3 (methyl chloroform) and PAN
(peroxyl acetyl nitrate). Sample load width
on ECD channels is 3 seconds gt Data set
correlates well with other fast measurements.
MSD channels The methyl halides CH3I, CH3Br,
CH3Cl, the sulfur compounds COS, CS2, the
hydrochlorofluorocarbons CHClF2 (HCFC-22),
C2H3Cl2F (HCFC-141b), C2H3ClF2 (HCFC-142b), and
the hydrofluorocarbon C2H2F4 (HFC-134a)
Sample load width of MSD channels is 2 min. gt
Data set correlates with time average of fast
measurements. TDL Channel Water Vapor
(Currently relocated back in UCATS.) Obtained
simultaneous measurements with multiple Water
Vapor instruments during TC4.
3
(No Transcript)
4
Well defined boundary conditions below Tropopause
and above 380 K Ray et. al.
1999
5
Contrast Between Seasons
6
Spatial/Temporal information in Source region
retained in Mixed region.
7
(No Transcript)
8
Out flow from Convective Events.
CR-AVE 02-09-2006
( In the gray aria mid flight we
see BL air from Amazon. )
CFC-11 250 ppt No Strato Loss.
COS loss of 100 ppt Vegetative up
take in BL.
HCFC-22 anthropogenic in BL?
CH3I elevated to 0.2 ppt marine
BL or bio-mass burn?
PAN ?
9
CR-AVE AVE-Houston
TC4 (high convection)
10
H. Singh et al., 1994 JGR
PAN Lifetime in the BL 1 hour !
PAN vs CO shows a high contrast between BL vs
Lower Trop.
PAN vs CO may be sensitive to inflow from the BL
vs Entrainment from the Lower Trop.
R. Talukdar et al. 1995 JGR
11
Lifetime of CO in TTL 1 Month (OH
and Photolysis.)
Data set contains information about convection
from all longitudes due to the zonal wend.
12
PAN Lifetime 1 Month in
the TTL
The following data set will also contain
information about convection from all longitudes
due to the zonal wends. But will also be
modified by O3 chemistry!
S.A. McKeen et al., 1997 GRL
Chemically important in the TTL and LS.
NOx/NOy and OH/HOx - Chem. equilibrium fast
in the TTL and LS.
- Test Measured vs. Calculated ratio
Photolysis of acetone is a source of OH and PAN
(through conversion of NOx).
PAN is NOx reservoir (stabilize for month)
Keim et als 1999 suggesting 20- 30 ppt PAN
Recommended
