
Global Warming is unequivocal PowerPoint PPT Presentation
1 / 20
Title: Global Warming is unequivocal
1
Global Warming is unequivocal
Kevin E Trenberth NCAR
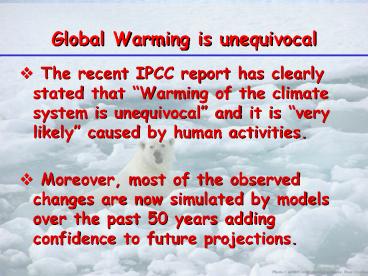
- The recent IPCC report has clearly stated that
Warming of the climate system is unequivocal
and it is very likely caused by human
activities. - Moreover, most of the observed changes are now
simulated by models over the past 50 years adding
confidence to future projections.
2
Global Warming is unequivocal
- Since 1970, rise in Decrease in
- Global surface temperatures NH Snow extent
- Tropospheric temperatures Arctic sea ice
- Global SSTs, ocean Ts Glaciers
- Global sea level Cold temperatures
- Water vapor
- Rainfall intensity
- Precipitation extratropics
- Hurricane intensity
- Drought
- Extreme high temperatures
- Heat waves
3
Global mean temperatures are rising faster with
time
Period Rate Years ?/decade
4
Global SST base period 1901-70
?C
5
North Atlantic hurricanes have increased with SSTs
N. Atlantic hurricane record best after 1944 with
aircraft surveillance. Global number and
percentage of intense hurricanes is increasing
(1944-2005)
SST
6
The oceans have not warmed uniformly
SST
Land Total
7
Sea level is rising in 20th century
- Rates of sea level rise
- 1.8 0.5 mm yr-1, 1961-2003
- 1.7 0.5 mm yr-1, 20th Century
- 3.1 0.7 mm yr-1, 1993-2003
- Sea level rise
- 0.17m 0.05 m 20th Century
8
Sea level is rising from ocean expansion and
melting glaciers
- Since 1993
- Global sea level
- has risen 41 mm
- (1.6 inches)
- 60 from
- expansion as ocean temperatures rise,
- 40 from melting glaciers
- Steve Nerem
9
Is ocean warming accelerating?
- Causes of decadal variability not well understood
- cooling due to volcanism?
- artefact due to temporally changing observing
system?
No statement on acceleration possible
Annual ocean heat content 0-700m relative to
1961-90 average
Ishii et al 2006 Willis et al 2004
Levitus WOA
10
Ocean Heat Content Anomaly Upper 750 m annual
means Error bars are sampling error only
No ARGO data All except SOLO/FSI All ARGO
except SOLO/FSI
Effect of cold bias in SOLO floats with FSI
sensors and warm bias in XBTs. Willis et al
2007 GRL
11
Ocean warming is strongest near the surface but
also penetrates to layers below, in particular in
Atlantic Ocean
Zonally averaged temperature trend 19552003
Few regions are coolingrelated to climate
variability
Pacific subtropical ocean circulation El Niño
Changes in NAO, PDO
warming gt 0.025C per decade
cooling lt -0.025C per decade
12
Most but not all parts of the Ocean are warming
Ocean heat content trend 1955-2003
corresponds to cooling lt -0.25 W/m2
corresponds to warming gt 0.25 W/m2
13
Ocean salinities are changing, indicating
changes in evaporation and precipitation
Zonally averaged salinity trend 19551998
Tropics in upper oceansare becoming saltier,in
particular in Atlantic/Indian
Mid-to-high latitudes are becoming fresher, in
particular in N-Pacific/N-Atlantic
Consistent with increase in atmospheric water
transport
saltier gt 0.005psu per decade
fresher lt - 0.005psu per decade
14
Evidence for reality of climate change
Glaciers melting
Muir Glacier, Alaska
1909 Toboggan Glacier Alaska 2000
1900 2003 Alpine glacier, Austria
15
Snow cover and Arctic sea ice are decreasing
Spring snow cover shows 5 stepwise drop during
1980s
Arctic sea ice area decreased by 2.7 per
decade (Summer -7.4/decade)
16
Glaciers and frozen ground are receding
Increased Glacier retreat since the early 1990s
17
Greenland and Antarctic ice sheets are shrinking
Greenland gains mass in the interior, but loses
more at the margins
18
Greenland and Antarctic ice sheets are shrinking
Antarctic ice sheet loses mass mostly through
increased glacier flow
19
Ice shelves influence glacier flow
The break up of the Larsen B ice shelf off the
Antarctic Peninsula in February 2002 is
illustrative of the speed up of glaciers after
the blocking of the ice shelf is removed.
Glaciers lost ice shelf and sped up
Other examples, such as Jakobshavn Glacier
(Greenland), show speed up in flow after
collapse of the floating glacier tongue.
Glacier still has ice shelf and did not speed up
20
Global Warming is unequivocal
- Since 1970, rise in Decrease in
- Carbon Dioxide, nitrous oxide NH Snow extent
- Global surface temperatures Arctic sea ice
- Global SSTs, ocean Ts Glaciers
- Global sea level Cold temperatures
- Water vapor
- Rainfall intensity
- Precipitation extratropics
- Hurricane intensity
- Drought
- Extreme high temperatures
- Heat waves
Help!
Recommended
