
2-D Steady Heat Equation PowerPoint PPT Presentation
Title: 2-D Steady Heat Equation
1
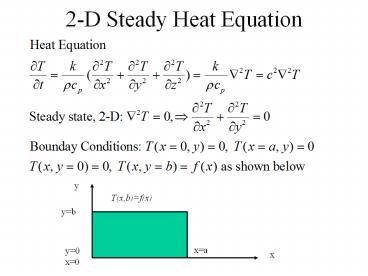
2-D Steady Heat Equation
y
T(x,b)f(x)
yb
xa
y0 x0
x
2
(No Transcript)
3
(No Transcript)
4
Example
5
(No Transcript)
6
Temperature Distribution in x at different y
stations
f(x)100(3-x)sin(x)
7
Constant temperature contour plot Red max
temperature Purple min temperature Each line
corresponds to a constant temperature, therefore,
the denser the line distribution, the steeper the
temperature gradient and vice versa. The
direction of the local heat transfer is normal to
the local constant temperature line and its
magnitude is inversely proportional to the local
spacing between the two neighboring constant
temperature lines.
8
Superposition of Two Solutions
0
0
TTB
0
0
0
T2(x,y)
TTA
0
T1(x,y)
0
TTB
0
T(x,y)T1(x,y)T2(x,y)
TTA
Recommended
