
Inequalities in the Use of Health Services PowerPoint PPT Presentation
1 / 1
Title: Inequalities in the Use of Health Services
1
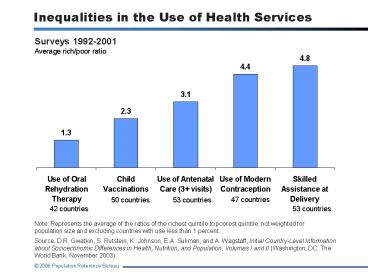
Inequalities in the Use of Health Services
Surveys 1992-2001 Average rich/poor ratio
50 countries
53 countries
47 countries
42 countries
53 countries
Note Represents the average of the ratios of the
richest quintile to poorest quintile, not
weighted for population size and excluding
countries with use less than 1 percent.
Source D.R. Gwatkin, S. Rutstein, K. Johnson,
E.A. Suliman, and A. Wagstaff, Initial
Country-Level Information about Socioeconomic
Differences in Health, Nutrition, and Population,
Volumes I and II (Washington, DC The World Bank,
November 2003).
Recommended
