
Diapositiva 1 PowerPoint PPT Presentation
1 / 2
Title: Diapositiva 1
1
SUPPLEMENTARY DATA
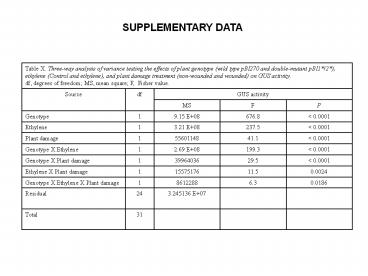
Table X. Three-way analysis of variance testing the effects of plant genotype (wild type pBI270 and double-mutant pBI1/2), ethylene (Control and ethylene), and plant damage treatment (non-wounded and wounded) on GUS activity. df, degrees of freedom MS, mean square F, Fisher value. Table X. Three-way analysis of variance testing the effects of plant genotype (wild type pBI270 and double-mutant pBI1/2), ethylene (Control and ethylene), and plant damage treatment (non-wounded and wounded) on GUS activity. df, degrees of freedom MS, mean square F, Fisher value. Table X. Three-way analysis of variance testing the effects of plant genotype (wild type pBI270 and double-mutant pBI1/2), ethylene (Control and ethylene), and plant damage treatment (non-wounded and wounded) on GUS activity. df, degrees of freedom MS, mean square F, Fisher value. Table X. Three-way analysis of variance testing the effects of plant genotype (wild type pBI270 and double-mutant pBI1/2), ethylene (Control and ethylene), and plant damage treatment (non-wounded and wounded) on GUS activity. df, degrees of freedom MS, mean square F, Fisher value. Table X. Three-way analysis of variance testing the effects of plant genotype (wild type pBI270 and double-mutant pBI1/2), ethylene (Control and ethylene), and plant damage treatment (non-wounded and wounded) on GUS activity. df, degrees of freedom MS, mean square F, Fisher value.
Source df GUS activity GUS activity GUS activity
Source df MS F P
Genotype 1 9.15 E08 676.8 lt 0.0001
Ethylene 1 3.21 E08 237.5 lt 0.0001
Plant damage 1 55601148 41.1 lt 0.0001
Genotype X Ethylene 1 2.69 E08 199.3 lt 0.0001
Genotype X Plant damage 1 39964036 29.5 lt 0.0001
Ethylene X Plant damage 1 15575176 11.5 0.0024
Genotype X Ethylene X Plant damage 1 8612288 6.3 0.0186
Residual 24 3.245136 E07
Total 31
2
Table 2. Matrix of pairwise multiple comparisons performed with the Tukey-HSD test following ANOVA (see Table 1). Table 2. Matrix of pairwise multiple comparisons performed with the Tukey-HSD test following ANOVA (see Table 1). Table 2. Matrix of pairwise multiple comparisons performed with the Tukey-HSD test following ANOVA (see Table 1). Table 2. Matrix of pairwise multiple comparisons performed with the Tukey-HSD test following ANOVA (see Table 1). Table 2. Matrix of pairwise multiple comparisons performed with the Tukey-HSD test following ANOVA (see Table 1). Table 2. Matrix of pairwise multiple comparisons performed with the Tukey-HSD test following ANOVA (see Table 1). Table 2. Matrix of pairwise multiple comparisons performed with the Tukey-HSD test following ANOVA (see Table 1). Table 2. Matrix of pairwise multiple comparisons performed with the Tukey-HSD test following ANOVA (see Table 1).
P- values P- values P- values P- values P- values P- values P- values
(2) (3) (4) (5) (6) (7) (8)
pBI1/2 - Ethylene-Non-wounded (1) 0.980668 0.999999 1 0.000147 0.000147 0.005442 0.000149
pBI1/2 - Ethylene-wounded (2) 0.942291 0.954669 0.000147 0.000147 0.045306 0.000174
pBI1/2 - Air-Non-wounded (3) 1 0.000147 0.000147 0.003307 0.000148
pBI1/2 - Air-wounded (4) 0.000147 0.000147 0.003743 0.000148
pBI270- Ethylene-Non-wounded (5) 0.000147 0.000147 0.000147
pBI270- Ethylene-wounded (6) 0.000147 0.000147
pBI270- Air-Non-wounded (7) 0.102764
pBI270- Air-wounded (8)
Recommended
