
3.7 - Graphing Linear Inequalities PowerPoint PPT Presentation
1 / 36
Title: 3.7 - Graphing Linear Inequalities
1
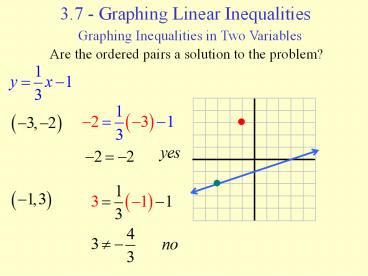
3.7 - Graphing Linear Inequalities
Graphing Inequalities in Two Variables
Are the ordered pairs a solution to the problem?
2
3.7 - Graphing Linear Inequalities
Graphing Inequalities in Two Variables
Are the ordered pairs a solution to the problem?
3
3.7 - Graphing Linear Inequalities
Graphing Inequalities in Two Variables
Are the ordered pairs a solution to the problem?
.
4
3.7 - Graphing LinearInequalities
Graphing Inequalities in Two Variables
Graph the solution.
5
3.7 - Graphing Linear Inequalities
Graphing Inequalities in Two Variables
Graph the solution.
6
3.7 - Graphing Linear Inequalities
Graphing Inequalities in Two Variables
Graph the solution.
7
3.7 - Graphing Linear Inequalities
Graphing Inequalities in Two Variables
Graph the solution.
8
(No Transcript)
9
4.1 - Systems of Linear Equations (2 variables)
Solving Systems of Linear Equations by Graphing
A system of linear equations allows the
relationship between two or more linear equations
to be compared and analyzed.
10
4.1 - Systems of Linear Equations (2 variables)
Solving Systems of Linear Equations by Graphing
Determine whether (3, 9) is a solution of the
following system.
Both statements are true, therefore (3, 9) is a
solution to the given system of linear equations.
11
4.1 - Systems of Linear Equations (2 variables)
Solving Systems of Linear Equations by Graphing
Determine whether (3, -2) is a solution of the
following system.
Both statements are not true, therefore (3, -2)
is not a solution to the given system of linear
equations.
12
4.1 - Systems of Linear Equations (2 variables)
Solving Systems of Linear Equations by Graphing
13
4.1 - Systems of Linear Equations (2 variables)
Solving Systems of Linear Equations by Graphing
14
4.1 - Systems of Linear Equations (2 variables)
Solving Systems of Linear Equations by Graphing
15
4.1 - Systems of Linear Equations (2 variables)
Solving Systems of Linear Equations by Graphing
Special Systems of Linear Equations
Consistent system has at least one solution.
Inconsistent system has no solution.
Independent equations have different graphs.
Dependent equations have identical graphs.
Consistent system
Independent equations
16
4.1 - Systems of Linear Equations (2 variables)
Solving Systems of Linear Equations by Graphing
Special Systems of Linear Equations
Consistent system has at least one solution.
Inconsistent system has no solution.
Independent equations have different graphs.
Dependent equations have identical graphs.
Inconsistent system
Independent equations
17
4.1 - Systems of Linear Equations (2 variables)
Solving Systems of Linear Equations by Graphing
Special Systems of Linear Equations
Consistent system has at least one solution.
Inconsistent system has no solution.
Independent equations have different graphs.
Dependent equations have identical graphs.
Consistent system
Dependent equations
18
4.1 - Systems of Linear Equations (2 variables)
Solving Systems of Linear Equations by
Substitution
Solution
19
4.1 - Systems of Linear Equations (2 variables)
Solving Systems of Linear Equations by
Substitution
Solution
20
4.1 - Systems of Linear Equations (2 variables)
Solving Systems of Linear Equations by
Elimination
21
4.1 - Systems of Linear Equations (2 variables)
Solving Systems of Linear Equations by
Elimination
Solution
22
4.1 - Systems of Linear Equations (2 variables)
Solving Systems of Linear Equations by
Elimination
Solution
23
4.1 - Systems of Linear Equations (2 variables)
Solving Systems of Linear Equations by
Elimination
Solution
24
4.1 - Systems of Linear Equations (2 variables)
Solving Systems of Linear Equations by
Elimination
Solution
(lines are the same)
25
4.1 - Systems of Linear Equations (2 variables)
Solving Systems of Linear Equations by
Elimination
No Solution
(lines are parallel)
26
4.3 - Systems of Linear Equations and Problem
Solving
The consumption of red meat and poultry are
defined by the given equations, where x
represents the number of years since 2003 and y
represents the pounds per year consumed. In what
year will the consumption be the same?
Substitution Method
27
4.3 - Systems of Linear Equations and Problem
Solving
The consumption of red meat and poultry are
defined by the given equations, where x
represents the number of years since 2003 and y
represents the pounds per year consumed. In what
year will the consumption be the same?
Substitution Method
28
4.3 - Systems of Linear Equations and Problem
Solving
A first number is seven greater than a second
number. Twice the first number is four more than
three times the second number. What are the
numbers?
1st number is x, 2nd number is y
Substitution Method
Solution
29
4.3 - Systems of Linear Equations and Problem
Solving
Two trains leave Tulsa, one traveling north and
the other south. After four hours, they are 376
miles apart. If one train is traveling ten miles
per hour faster than the other, what is the speed
of each train?
Train Rate Time Distance
North
South
x
4
4x
y
4y
4
Substitution Method
30
4.3 - Systems of Linear Equations and Problem
Solving
One solution contains 20 acid and a second
solution contains 50 acid. How many ounces of
each solution should be mixed in order to have
sixty ounces of a 30 solution?
Solution Ounces Decimal Pure Acid
20
50
30
x
0.2x
0.2
y
0.5y
0.5
60
(60)(0.3)
0.3
31
4.3 - Systems of Linear Equations and Problem
Solving
One solution contains 20 acid and a second
solutions contains 50 acid. How many ounces of
each solution should be mixed in order to have
sixty ounces of a 30 solution?
Elimination Method
32
4.5 Systems of Linear Inequalities
Graphing Inequalities in Two Variables
Graph the Union.
33
4.5 Systems of Linear Inequalities
Graphing Inequalities in Two Variables
Graph the solution (Graph the intersection).
34
4.5 Systems of Linear Inequalities
Graphing Inequalities in Two Variables
Graph the union.
35
4.5 Systems of Linear Inequalities
Graphing Inequalities in Two Variables
Graph the solution. (Graph the intersection)
36
4.5 Systems of Linear Inequalities
Graphing Inequalities in Two Variables
Graph the solution. (Graph the intersection)
Recommended
