
An Autonomous Inexpensive Robust CO2 Analyzer (AIRCOA) PowerPoint PPT Presentation
Title: An Autonomous Inexpensive Robust CO2 Analyzer (AIRCOA)
1
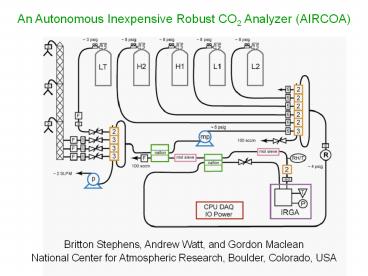
An Autonomous Inexpensive Robust CO2 Analyzer
(AIRCOA)
Britton Stephens, Andrew Watt, and Gordon
Maclean National Center for Atmospheric Research,
Boulder, Colorado, USA
2
Using high frequency data makes signals bigger,
but the annual-mean signals are still very small
To measure 0.2 GtCyr-1 source/sink to /- 25
need to measure regional annual mean gradients to
0.1-0.2 ppm
Flux footprint, in ppm(GtCyr-1)-1, for a 106 km2
chaparral region in the U.S. Southwest (Gloor et
al., 1999).
3
(No Transcript)
4
Potential source of bias AIRCOA solution
Relating to WMO CO2 Scale Dedicated CO2 and O2 calibration transfer facility
Short-term IRGA noise Average for 2 minutes to get better than 0.1 ppm precision
Drift in IRGA sensitivity 4-hourly 4-point calibrations and 30-minute 1-point calibrations
IRGA pressure sensitivity Automated 4-hourly pressure sensitivity measurements
IRGA temperature sensitivity 30-minute 1-point calibrations, temperature control at some sites
Incomplete drying of air Slow enough flow (100 sccm), two 96 Nafion driers, downstream humidity sensor to verify performance
Drying system altering CO2 Continuous flows and pressures through Nafions and run surveillance gas through entire system
Incomplete flushing of cell and dead volumes Fast enough flow (100 sccm), alternate calibration sequence low-to-high / high-to-low to look for effects
Leaks through fittings, solenoid valves, and pumps Automated 8-hourly positive pressure leak-down and 4-hourly ambient pressure leak-up checks
Pressure broadening without Ar Use calibration gases made with real air
Fossil CO2 in calibration gases and different field and lab 13C sensitivities Laboratory tests limit current effect to 0.05 ppm, long-term plans to use cylinders with natural CO2
Regulator temperature effects Tests suggest effect is negligible, but could be regulator dependent
Regulator flushing effects Repeat calibration tests suggest the effect is negligible
Whole-system diagnostics and comparability verification Long-term surveillance tank analyzed every 8 hours, co-location with other programs, rotating cylinders, and laboratory comparisons
Delay in diagnosis of errors Near real-time data acquisition, processing, and dissemination
5
Potential source of bias AIRCOA solution
Relating to WMO CO2 Scale Dedicated CO2 and O2 calibration transfer facility
Short-term IRGA noise Average for 2 minutes to get better than 0.1 ppm precision
Drift in IRGA sensitivity 4-hourly 4-point calibrations and 30-minute 1-point calibrations
IRGA pressure sensitivity Automated 4-hourly pressure sensitivity measurements
IRGA temperature sensitivity 30-minute 1-point calibrations, temperature control at some sites
Incomplete drying of air Slow enough flow (100 sccm), two 96 Nafion driers, downstream humidity sensor to verify performance
Drying system altering CO2 Continuous flows and pressures through Nafions and run surveillance gas through entire system
Incomplete flushing of cell and dead volumes Fast enough flow (100 sccm), alternate calibration sequence low-to-high / high-to-low to look for effects
Leaks through fittings, solenoid valves, and pumps Automated 8-hourly positive pressure leak-down and 4-hourly ambient pressure leak-up checks
Pressure broadening without Ar Use calibration gases made with real air
Fossil CO2 in calibration gases and different field and lab 13C sensitivities Laboratory tests limit current effect to 0.05 ppm, long-term plans to use cylinders with natural CO2
Regulator temperature effects Tests suggest effect is negligible, but could be regulator dependent
Regulator flushing effects Repeat calibration tests suggest the effect is negligible
Whole-system diagnostics and comparability verification Long-term surveillance tank analyzed every 8 hours, co-location with other programs, rotating cylinders, and laboratory comparisons
Delay in diagnosis of errors Near real-time data acquisition, processing, and dissemination
6
NCAR CO2 and O2/N2 Calibration Facility
7
Potential source of bias AIRCOA solution
Relating to WMO CO2 Scale Dedicated CO2 and O2 calibration transfer facility
Short-term IRGA noise Average for 2 minutes to get better than 0.1 ppm precision
Drift in IRGA sensitivity 4-hourly 4-point calibrations and 30-minute 1-point calibrations
IRGA pressure sensitivity Automated 4-hourly pressure sensitivity measurements
IRGA temperature sensitivity 30-minute 1-point calibrations, temperature control at some sites
Incomplete drying of air Slow enough flow (100 sccm), two 96 Nafion driers, downstream humidity sensor to verify performance
Drying system altering CO2 Continuous flows and pressures through Nafions and run surveillance gas through entire system
Incomplete flushing of cell and dead volumes Fast enough flow (100 sccm), alternate calibration sequence low-to-high / high-to-low to look for effects
Leaks through fittings, solenoid valves, and pumps Automated 8-hourly positive pressure leak-down and 4-hourly ambient pressure leak-up checks
Pressure broadening without Ar Use calibration gases made with real air
Fossil CO2 in calibration gases and different field and lab 13C sensitivities Laboratory tests limit current effect to 0.05 ppm, long-term plans to use cylinders with natural CO2
Regulator temperature effects Tests suggest effect is negligible, but could be regulator dependent
Regulator flushing effects Repeat calibration tests suggest the effect is negligible
Whole-system diagnostics and comparability verification Long-term surveillance tank analyzed every 8 hours, co-location with other programs, rotating cylinders, and laboratory comparisons
Delay in diagnosis of errors Near real-time data acquisition, processing, and dissemination
8
CO2 signal averaged over 2.5 min. measurement
cycle
9
Potential source of bias AIRCOA solution
Relating to WMO CO2 Scale Dedicated CO2 and O2 calibration transfer facility
Short-term IRGA noise Average for 2 minutes to get better than 0.1 ppm precision
Drift in IRGA sensitivity 4-hourly 4-point calibrations and 30-minute 1-point calibrations
IRGA pressure sensitivity Automated 4-hourly pressure sensitivity measurements
IRGA temperature sensitivity 30-minute 1-point calibrations, temperature control at some sites
Incomplete drying of air Slow enough flow (100 sccm), two 96 Nafion driers, downstream humidity sensor to verify performance
Drying system altering CO2 Continuous flows and pressures through Nafions and run surveillance gas through entire system
Incomplete flushing of cell and dead volumes Fast enough flow (100 sccm), alternate calibration sequence low-to-high / high-to-low to look for effects
Leaks through fittings, solenoid valves, and pumps Automated 8-hourly positive pressure leak-down and 4-hourly ambient pressure leak-up checks
Pressure broadening without Ar Use calibration gases made with real air
Fossil CO2 in calibration gases and different field and lab 13C sensitivities Laboratory tests limit current effect to 0.05 ppm, long-term plans to use cylinders with natural CO2
Regulator temperature effects Tests suggest effect is negligible, but could be regulator dependent
Regulator flushing effects Repeat calibration tests suggest the effect is negligible
Whole-system diagnostics and comparability verification Long-term surveillance tank analyzed every 8 hours, co-location with other programs, rotating cylinders, and laboratory comparisons
Delay in diagnosis of errors Near real-time data acquisition, processing, and dissemination
10
Calibration sequence
11
Potential source of bias AIRCOA solution
Relating to WMO CO2 Scale Dedicated CO2 and O2 calibration transfer facility
Short-term IRGA noise Average for 2 minutes to get better than 0.1 ppm precision
Drift in IRGA sensitivity 4-hourly 4-point calibrations and 30-minute 1-point calibrations
IRGA pressure sensitivity Automated 4-hourly pressure sensitivity measurements
IRGA temperature sensitivity 30-minute 1-point calibrations, temperature control at some sites
Incomplete drying of air Slow enough flow (100 sccm), two 96 Nafion driers, downstream humidity sensor to verify performance
Drying system altering CO2 Continuous flows and pressures through Nafions and run surveillance gas through entire system
Incomplete flushing of cell and dead volumes Fast enough flow (100 sccm), alternate calibration sequence low-to-high / high-to-low to look for effects
Leaks through fittings, solenoid valves, and pumps Automated 8-hourly positive pressure leak-down and 4-hourly ambient pressure leak-up checks
Pressure broadening without Ar Use calibration gases made with real air
Fossil CO2 in calibration gases and different field and lab 13C sensitivities Laboratory tests limit current effect to 0.05 ppm, long-term plans to use cylinders with natural CO2
Regulator temperature effects Tests suggest effect is negligible, but could be regulator dependent
Regulator flushing effects Repeat calibration tests suggest the effect is negligible
Whole-system diagnostics and comparability verification Long-term surveillance tank analyzed every 8 hours, co-location with other programs, rotating cylinders, and laboratory comparisons
Delay in diagnosis of errors Near real-time data acquisition, processing, and dissemination
12
Empirical pressure correction
13
Potential source of bias AIRCOA solution
Relating to WMO CO2 Scale Dedicated CO2 and O2 calibration transfer facility
Short-term IRGA noise Average for 2 minutes to get better than 0.1 ppm precision
Drift in IRGA sensitivity 4-hourly 4-point calibrations and 30-minute 1-point calibrations
IRGA pressure sensitivity Automated 4-hourly pressure sensitivity measurements
IRGA temperature sensitivity 30-minute 1-point calibrations, temperature control at some sites
Incomplete drying of air Slow enough flow (100 sccm), two 96 Nafion driers, downstream humidity sensor to verify performance
Drying system altering CO2 Continuous flows and pressures through Nafions and run surveillance gas through entire system
Incomplete flushing of cell and dead volumes Fast enough flow (100 sccm), alternate calibration sequence low-to-high / high-to-low to look for effects
Leaks through fittings, solenoid valves, and pumps Automated 8-hourly positive pressure leak-down and 4-hourly ambient pressure leak-up checks
Pressure broadening without Ar Use calibration gases made with real air
Fossil CO2 in calibration gases and different field and lab 13C sensitivities Laboratory tests limit current effect to 0.05 ppm, long-term plans to use cylinders with natural CO2
Regulator temperature effects Tests suggest effect is negligible, but could be regulator dependent
Regulator flushing effects Repeat calibration tests suggest the effect is negligible
Whole-system diagnostics and comparability verification Long-term surveillance tank analyzed every 8 hours, co-location with other programs, rotating cylinders, and laboratory comparisons
Delay in diagnosis of errors Near real-time data acquisition, processing, and dissemination
14
Empirical temperature correction
SPL 9/4-9/18
NWR 9/18
15
Potential source of bias AIRCOA solution
Relating to WMO CO2 Scale Dedicated CO2 and O2 calibration transfer facility
Short-term IRGA noise Average for 2 minutes to get better than 0.1 ppm precision
Drift in IRGA sensitivity 4-hourly 4-point calibrations and 30-minute 1-point calibrations
IRGA pressure sensitivity Automated 4-hourly pressure sensitivity measurements
IRGA temperature sensitivity 30-minute 1-point calibrations, temperature control at some sites
Incomplete drying of air Slow enough flow (100 sccm), two 96 Nafion driers, downstream humidity sensor to verify performance
Drying system altering CO2 Continuous flows and pressures through Nafions and run surveillance gas through entire system
Incomplete flushing of cell and dead volumes Fast enough flow (100 sccm), alternate calibration sequence low-to-high / high-to-low to look for effects
Leaks through fittings, solenoid valves, and pumps Automated 8-hourly positive pressure leak-down and 4-hourly ambient pressure leak-up checks
Pressure broadening without Ar Use calibration gases made with real air
Fossil CO2 in calibration gases and different field and lab 13C sensitivities Laboratory tests limit current effect to 0.05 ppm, long-term plans to use cylinders with natural CO2
Regulator temperature effects Tests suggest effect is negligible, but could be regulator dependent
Regulator flushing effects Repeat calibration tests suggest the effect is negligible
Whole-system diagnostics and comparability verification Long-term surveillance tank analyzed every 8 hours, co-location with other programs, rotating cylinders, and laboratory comparisons
Delay in diagnosis of errors Near real-time data acquisition, processing, and dissemination
16
Drying system monitoring
A change of 0.5 RH is approximately 300 ppm H2O,
which would cause a dilution error of 0.1 ppm in
CO2
17
Potential source of bias AIRCOA solution
Relating to WMO CO2 Scale Dedicated CO2 and O2 calibration transfer facility
Short-term IRGA noise Average for 2 minutes to get better than 0.1 ppm precision
Drift in IRGA sensitivity 4-hourly 4-point calibrations and 30-minute 1-point calibrations
IRGA pressure sensitivity Automated 4-hourly pressure sensitivity measurements
IRGA temperature sensitivity 30-minute 1-point calibrations, temperature control at some sites
Incomplete drying of air Slow enough flow (100 sccm), two 96 Nafion driers, downstream humidity sensor to verify performance
Drying system altering CO2 Continuous flows and pressures through Nafions and run surveillance gas through entire system
Incomplete flushing of cell and dead volumes Fast enough flow (100 sccm), alternate calibration sequence low-to-high / high-to-low to look for effects
Leaks through fittings, solenoid valves, and pumps Automated 8-hourly positive pressure leak-down and 4-hourly ambient pressure leak-up checks
Pressure broadening without Ar Use calibration gases made with real air
Fossil CO2 in calibration gases and different field and lab 13C sensitivities Laboratory tests limit current effect to 0.05 ppm, long-term plans to use cylinders with natural CO2
Regulator temperature effects Tests suggest effect is negligible, but could be regulator dependent
Regulator flushing effects Repeat calibration tests suggest the effect is negligible
Whole-system diagnostics and comparability verification Long-term surveillance tank analyzed every 8 hours, co-location with other programs, rotating cylinders, and laboratory comparisons
Delay in diagnosis of errors Near real-time data acquisition, processing, and dissemination
18
Nafion absorption effect
Flow pulled through Nafion went from 300 to 50
sccm at t 30 sec
19
Potential source of bias AIRCOA solution
Relating to WMO CO2 Scale Dedicated CO2 and O2 calibration transfer facility
Short-term IRGA noise Average for 2 minutes to get better than 0.1 ppm precision
Drift in IRGA sensitivity 4-hourly 4-point calibrations and 30-minute 1-point calibrations
IRGA pressure sensitivity Automated 4-hourly pressure sensitivity measurements
IRGA temperature sensitivity 30-minute 1-point calibrations, temperature control at some sites
Incomplete drying of air Slow enough flow (100 sccm), two 96 Nafion driers, downstream humidity sensor to verify performance
Drying system altering CO2 Continuous flows and pressures through Nafions and run surveillance gas through entire system
Incomplete flushing of cell and dead volumes Fast enough flow (100 sccm), alternate calibration sequence low-to-high / high-to-low to look for effects
Leaks through fittings, solenoid valves, and pumps Automated 8-hourly positive pressure leak-down and 4-hourly ambient pressure leak-up checks
Pressure broadening without Ar Use calibration gases made with real air
Fossil CO2 in calibration gases and different field and lab 13C sensitivities Laboratory tests limit current effect to 0.05 ppm, long-term plans to use cylinders with natural CO2
Regulator temperature effects Tests suggest effect is negligible, but could be regulator dependent
Regulator flushing effects Repeat calibration tests suggest the effect is negligible
Whole-system diagnostics and comparability verification Long-term surveillance tank analyzed every 8 hours, co-location with other programs, rotating cylinders, and laboratory comparisons
Delay in diagnosis of errors Near real-time data acquisition, processing, and dissemination
20
Empirical flushing correction
21
Potential source of bias AIRCOA solution
Relating to WMO CO2 Scale Dedicated CO2 and O2 calibration transfer facility
Short-term IRGA noise Average for 2 minutes to get better than 0.1 ppm precision
Drift in IRGA sensitivity 4-hourly 4-point calibrations and 30-minute 1-point calibrations
IRGA pressure sensitivity Automated 4-hourly pressure sensitivity measurements
IRGA temperature sensitivity 30-minute 1-point calibrations, temperature control at some sites
Incomplete drying of air Slow enough flow (100 sccm), two 96 Nafion driers, downstream humidity sensor to verify performance
Drying system altering CO2 Continuous flows and pressures through Nafions and run surveillance gas through entire system
Incomplete flushing of cell and dead volumes Fast enough flow (100 sccm), alternate calibration sequence low-to-high / high-to-low to look for effects
Leaks through fittings, solenoid valves, and pumps Automated 8-hourly positive pressure leak-down and 4-hourly ambient pressure leak-up checks
Pressure broadening without Ar Use calibration gases made with real air
Fossil CO2 in calibration gases and different field and lab 13C sensitivities Laboratory tests limit current effect to 0.05 ppm, long-term plans to use cylinders with natural CO2
Regulator temperature effects Tests suggest effect is negligible, but could be regulator dependent
Regulator flushing effects Repeat calibration tests suggest the effect is negligible
Whole-system diagnostics and comparability verification Long-term surveillance tank analyzed every 8 hours, co-location with other programs, rotating cylinders, and laboratory comparisons
Delay in diagnosis of errors Near real-time data acquisition, processing, and dissemination
22
Automated (4- or 8-hourly) leak checks
A positive trend of 0.3 kPa/min would be a leak
rate of 0.1 sccm which if 100 ppm different would
cause a 0.1 ppm bias
23
Potential source of bias AIRCOA solution
Relating to WMO CO2 Scale Dedicated CO2 and O2 calibration transfer facility
Short-term IRGA noise Average for 2 minutes to get better than 0.1 ppm precision
Drift in IRGA sensitivity 4-hourly 4-point calibrations and 30-minute 1-point calibrations
IRGA pressure sensitivity Automated 4-hourly pressure sensitivity measurements
IRGA temperature sensitivity 30-minute 1-point calibrations, temperature control at some sites
Incomplete drying of air Slow enough flow (100 sccm), two 96 Nafion driers, downstream humidity sensor to verify performance
Drying system altering CO2 Continuous flows and pressures through Nafions and run surveillance gas through entire system
Incomplete flushing of cell and dead volumes Fast enough flow (100 sccm), alternate calibration sequence low-to-high / high-to-low to look for effects
Leaks through fittings, solenoid valves, and pumps Automated 8-hourly positive pressure leak-down and 4-hourly ambient pressure leak-up checks
Pressure broadening without Ar Use calibration gases made with real air
Fossil CO2 in calibration gases and different field and lab 13C sensitivities Laboratory tests limit current effect to 0.05 ppm, long-term plans to use cylinders with natural CO2
Regulator temperature effects Tests suggest effect is negligible, but could be regulator dependent
Regulator flushing effects Repeat calibration tests suggest the effect is negligible
Whole-system diagnostics and comparability verification Long-term surveillance tank analyzed every 8 hours, co-location with other programs, rotating cylinders, and laboratory comparisons
Delay in diagnosis of errors Near real-time data acquisition, processing, and dissemination
24
Potential source of bias AIRCOA solution
Relating to WMO CO2 Scale Dedicated CO2 and O2 calibration transfer facility
Short-term IRGA noise Average for 2 minutes to get better than 0.1 ppm precision
Drift in IRGA sensitivity 4-hourly 4-point calibrations and 30-minute 1-point calibrations
IRGA pressure sensitivity Automated 4-hourly pressure sensitivity measurements
IRGA temperature sensitivity 30-minute 1-point calibrations, temperature control at some sites
Incomplete drying of air Slow enough flow (100 sccm), two 96 Nafion driers, downstream humidity sensor to verify performance
Drying system altering CO2 Continuous flows and pressures through Nafions and run surveillance gas through entire system
Incomplete flushing of cell and dead volumes Fast enough flow (100 sccm), alternate calibration sequence low-to-high / high-to-low to look for effects
Leaks through fittings, solenoid valves, and pumps Automated 8-hourly positive pressure leak-down and 4-hourly ambient pressure leak-up checks
Pressure broadening without Ar Use calibration gases made with real air
Fossil CO2 in calibration gases and different field and lab 13C sensitivities Laboratory tests limit current effect to 0.05 ppm, long-term plans to use cylinders with natural CO2
Regulator temperature effects Tests suggest effect is negligible, but could be regulator dependent
Regulator flushing effects Repeat calibration tests suggest the effect is negligible
Whole-system diagnostics and comparability verification Long-term surveillance tank analyzed every 8 hours, co-location with other programs, rotating cylinders, and laboratory comparisons
Delay in diagnosis of errors Near real-time data acquisition, processing, and dissemination
25
Potential source of bias AIRCOA solution
Relating to WMO CO2 Scale Dedicated CO2 and O2 calibration transfer facility
Short-term IRGA noise Average for 2 minutes to get better than 0.1 ppm precision
Drift in IRGA sensitivity 4-hourly 4-point calibrations and 30-minute 1-point calibrations
IRGA pressure sensitivity Automated 4-hourly pressure sensitivity measurements
IRGA temperature sensitivity 30-minute 1-point calibrations, temperature control at some sites
Incomplete drying of air Slow enough flow (100 sccm), two 96 Nafion driers, downstream humidity sensor to verify performance
Drying system altering CO2 Continuous flows and pressures through Nafions and run surveillance gas through entire system
Incomplete flushing of cell and dead volumes Fast enough flow (100 sccm), alternate calibration sequence low-to-high / high-to-low to look for effects
Leaks through fittings, solenoid valves, and pumps Automated 8-hourly positive pressure leak-down and 4-hourly ambient pressure leak-up checks
Pressure broadening without Ar Use calibration gases made with real air
Fossil CO2 in calibration gases and different field and lab 13C sensitivities Laboratory tests limit current effect to 0.05 ppm, long-term plans to use cylinders with natural CO2
Regulator temperature effects Tests suggest effect is negligible, but could be regulator dependent
Regulator flushing effects Repeat calibration tests suggest the effect is negligible
Whole-system diagnostics and comparability verification Long-term surveillance tank analyzed every 8 hours, co-location with other programs, rotating cylinders, and laboratory comparisons
Delay in diagnosis of errors Near real-time data acquisition, processing, and dissemination
26
Regulator oven tests
Three cylinders were in the oven and one (green
dots) was not
27
Potential source of bias AIRCOA solution
Relating to WMO CO2 Scale Dedicated CO2 and O2 calibration transfer facility
Short-term IRGA noise Average for 2 minutes to get better than 0.1 ppm precision
Drift in IRGA sensitivity 4-hourly 4-point calibrations and 30-minute 1-point calibrations
IRGA pressure sensitivity Automated 4-hourly pressure sensitivity measurements
IRGA temperature sensitivity 30-minute 1-point calibrations, temperature control at some sites
Incomplete drying of air Slow enough flow (100 sccm), two 96 Nafion driers, downstream humidity sensor to verify performance
Drying system altering CO2 Continuous flows and pressures through Nafions and run surveillance gas through entire system
Incomplete flushing of cell and dead volumes Fast enough flow (100 sccm), alternate calibration sequence low-to-high / high-to-low to look for effects
Leaks through fittings, solenoid valves, and pumps Automated 8-hourly positive pressure leak-down and 4-hourly ambient pressure leak-up checks
Pressure broadening without Ar Use calibration gases made with real air
Fossil CO2 in calibration gases and different field and lab 13C sensitivities Laboratory tests limit current effect to 0.05 ppm, long-term plans to use cylinders with natural CO2
Regulator temperature effects Tests suggest effect is negligible, but could be regulator dependent
Regulator flushing effects Repeat calibration tests suggest the effect is negligible
Whole-system diagnostics and comparability verification Long-term surveillance tank analyzed every 8 hours, co-location with other programs, rotating cylinders, and laboratory comparisons
Delay in diagnosis of errors Near real-time data acquisition, processing, and dissemination
28
Regulator flushing tests
29
Potential source of bias AIRCOA solution
Relating to WMO CO2 Scale Dedicated CO2 and O2 calibration transfer facility
Short-term IRGA noise Average for 2 minutes to get better than 0.1 ppm precision
Drift in IRGA sensitivity 4-hourly 4-point calibrations and 30-minute 1-point calibrations
IRGA pressure sensitivity Automated 4-hourly pressure sensitivity measurements
IRGA temperature sensitivity 30-minute 1-point calibrations, temperature control at some sites
Incomplete drying of air Slow enough flow (100 sccm), two 96 Nafion driers, downstream humidity sensor to verify performance
Drying system altering CO2 Continuous flows and pressures through Nafions and run surveillance gas through entire system
Incomplete flushing of cell and dead volumes Fast enough flow (100 sccm), alternate calibration sequence low-to-high / high-to-low to look for effects
Leaks through fittings, solenoid valves, and pumps Automated 8-hourly positive pressure leak-down and 4-hourly ambient pressure leak-up checks
Pressure broadening without Ar Use calibration gases made with real air
Fossil CO2 in calibration gases and different field and lab 13C sensitivities Laboratory tests limit current effect to 0.05 ppm, long-term plans to use cylinders with natural CO2
Regulator temperature effects Tests suggest effect is negligible, but could be regulator dependent
Regulator flushing effects Repeat calibration tests suggest the effect is negligible
Whole-system diagnostics and comparability verification Long-term surveillance tank analyzed every 8 hours, co-location with other programs, rotating cylinders, and laboratory comparisons
Delay in diagnosis of errors Near real-time data acquisition, processing, and dissemination
30
Laboratory intercomparisons
Laboratory offsets less than 0.05 ppm (1-sigma
0.13 ppm)
Field surveillance tanks
2.5-month average field differences from assigned
values 0.01 to 0.10 ppm (1-sigma 0.10 to 0.13
ppm)
31
Potential source of bias AIRCOA solution
Relating to WMO CO2 Scale Dedicated CO2 and O2 calibration transfer facility
Short-term IRGA noise Average for 2 minutes to get better than 0.1 ppm precision
Drift in IRGA sensitivity 4-hourly 4-point calibrations and 30-minute 1-point calibrations
IRGA pressure sensitivity Automated 4-hourly pressure sensitivity measurements
IRGA temperature sensitivity 30-minute 1-point calibrations, temperature control at some sites
Incomplete drying of air Slow enough flow (100 sccm), two 96 Nafion driers, downstream humidity sensor to verify performance
Drying system altering CO2 Continuous flows and pressures through Nafions and run surveillance gas through entire system
Incomplete flushing of cell and dead volumes Fast enough flow (100 sccm), alternate calibration sequence low-to-high / high-to-low to look for effects
Leaks through fittings, solenoid valves, and pumps Automated 8-hourly positive pressure leak-down and 4-hourly ambient pressure leak-up checks
Pressure broadening without Ar Use calibration gases made with real air
Fossil CO2 in calibration gases and different field and lab 13C sensitivities Laboratory tests limit current effect to 0.05 ppm, long-term plans to use cylinders with natural CO2
Regulator temperature effects Tests suggest effect is negligible, but could be regulator dependent
Regulator flushing effects Repeat calibration tests suggest the effect is negligible
Whole-system diagnostics and comparability verification Long-term surveillance tank analyzed every 8 hours, co-location with other programs, rotating cylinders, and laboratory comparisons
Delay in diagnosis of errors Near real-time data acquisition, processing, and dissemination
32
Automated web-based output
http//www.eol.ucar.edu/stephens/RACCOON
33
Power Budget
Component Measured Amps _at_ 12 VDC Watts
Purge pump 0.61 7.3
Sample pump 0.09 1.1
Computer (incl. PS/DAQ/Relays) 0.42 5.0
RH/T sensor 0.0014 lt0.02
7 mass-flowmeters lt 0.001 lt0.01
2 solenoid valves 0.19 2.3
Li820 0.35 4.2
Total 1.67 20.0
Measured total 1.7 20.4
Measured AC Power 0.24 Amps at 120 V / 60 Hz 28 W
Recommended
