
Circle Graphs PowerPoint PPT Presentation
1 / 3
Title: Circle Graphs
1
Circle Graphs
COURSE 2 LESSON 7-9
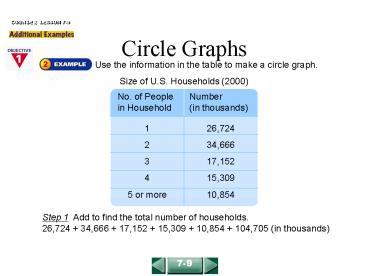
Use the information in the table to make a
circle graph.
Size of U.S. Households (2000)
Step 1 Add to find the total number of
households. 26,724 34,666 17,152 15,309
10,854 104,705 (in thousands)
7-9
2
Circle Graphs
COURSE 2 LESSON 7-9
(continued)
7-9
3
Circle Graphs
COURSE 2 LESSON 7-9
The circle graph shows how a class of 48 students
spends free time after lunch. 1. What percent
study or do extracurricular activities? 2.
How many students spend time on
extracurricular activities? 3. Find the
measure of the central angle that you would draw
to represent 15 in a circle graph.
39
12
54º
7-9
Recommended
