
EKG Basics PowerPoint PPT Presentation
1 / 75
Title: EKG Basics
1
EKG Basics
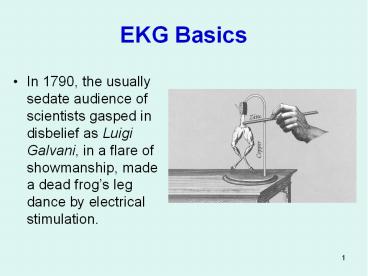
- In 1790, the usually sedate audience of
scientists gasped in disbelief as Luigi Galvani,
in a flare of showmanship, made a dead frogs leg
dance by electrical stimulation.
2
EKG Basics
- Galvani knew that the electrical current would
stimulate the frogs legs to jump, and with
repeated stimuli, he could make them dance.
3
EKG Basics
- In the 1790s, bringing a dead frog back to
life was a shocking and ghastly supernatural
feat. - Galvani loved shocking people!
4
EKG Basics
- While conducting research in 1855, Kollicker and
Mueller found that when the motor nerve to a
frogs leg was laid over its isolated beating
heart, the leg kicked with each heartbeat.
5
EKG Basics
- Eureka! they thought, the same electrical
stimulus that causes a frogs leg to kick must
cause the heart to beat. - Therefore, the beating of the heart must be due
to a rhythmic discharge of electrical stimuli.
6
EKG Basics
- In the mid 1880s, while using sensor electrodes
placed on a mans skin, Ludwig and Waller
discovered that the hearts rhythmic electrical
activity could be monitored from a persons skin. - However, their apparatus was not sensitive enough
for clinical use.
7
EKG Basics
- Enter Willem Einthoven, a brilliant scientist who
suspended a silvered wire between the poles of a
magnet. - Two skin sensors (electrodes) placed on a man
were then connected across the silvered wire,
which ran between the two poles of the magnet.
8
EKG Basics
- The silvered wire (suspended in the magnetic
field) twitched to the rhythm of the subjects
heartbeat.
- This was very interesting, but Einthoven wanted a
timed record.
9
EKG Basics
- So Einthoven projected a tiny light beam through
holes in the magnets poles, across the twitching
silvered wire. - The wires rhythmic movements were recorded as
waves (named P, QRS, and T) on a moving scroll of
photographic paper.
10
EKG Basics
- The rhythmic movements of the wire (representing
the heartbeat) created a series of distinct waves
in repeating cycles. - The waves were named P, QRS, and T.
- The clever Einthoven reasoned that he could
record a hearts abnormal electrical activity and
compare it to the normal.
11
EKG Basics
- Thus, a great diagnostic tool, Einthovens
Electrokardiogram was created in 1901.
12
EKG Basics
- The electrocardiogram (EKG) records the
electrical activity of the heart, providing a
record of cardiac electrical activity, as well as
valuable information about the hearts function
and structure.
13
EKG Basics
- The EKG is often recorded on a ruled piece a
paper that gives a written record of cardiac
activity. - Cardiac monitors and cardiac telemetry provides
the same information on a display screen.
14
EKG Basics
- The EKG records the electrical impulses that
stimulate the heart muscle (myocardium) to
contract.
15
EKG Basics
- The hearts dominant pacemaker, the SA Node,
begins the impulse of depolarization which
spreads outward in wave fashion, stimulating the
atria to contract.
16
EKG Basics
- The SA Node is the hearts dominant pacemaker,
and its pacing activity is known as Sinus
Rhythm. - The ability to generate pacemaking stimuli is
known as automaticity. - Other regions of the heart also have
automaticity, at slower rates than the SA Node.
17
The P Wave
- The electrical impulse, originating at the SA
Node, spreads as a wave of depolarization through
both atria, and this produces the P Wave on the
EKG.
18
The P Wave
- Thus, the P wave represents the electrical
activity (depolarization) of both atria, and it
also represents the simultaneous contraction of
the atria.
19
The AV Node
- The atrial depolarization stimulus reaches the AV
Node, where depolarization slows, producing a
brief pause, thus allowing the blood in the atria
to enter the ventricles.
20
The AV Node
- Remember, the AV Node is the only electrical
conduction pathway between the atria and the
ventricles.
21
HIS Bundle and Left and Right Bundle Branches
- Depolarization passes through the AV Node slowly,
but upon reaching the ventricular conduction
system, depolarization conducts very rapidly
through the HIS Bundle, and the Left and Right
Bundle Branches.
22
Purkinje Fibers
- The left and right Bundle Branches transmits the
wave of electrical activity to the Purkinje
Fibers. - The Purkinje Fibers distribute the depolarization
stimulus to the ventricular myocardial cells,
producing a QRS complex on the EKG.
23
Ventricular Conduction System
24
The Q Wave
- The Q Wave is the first downward stroke of the
QRS Complex, and it is followed by an upward R
Wave. - The Q Wave is often not present.
25
QRS Complex
- The upward R Wave is followed by a downward S
Wave. This total QRS Complex represents the
electrical activity of ventricular depolarization.
26
ST Segment
- Following the QRS complex, there is a segment of
horizontal baseline known as the ST Segment, and
then a broad T Wave appears. - The ST Segment represents the initial phase of
Ventricular Repolarization.
27
ST Segment
- The ST Segment should be flat and level with the
baseline. - If the ST Segment is elevated or depressed beyond
the baseline, it is a sign of serious problems.
ST Normal ST
Elevation
28
T Wave
- The T Wave represents the final rapid phase of
ventricular repolarization. - At this time, the ventricular myocardial cells
recover their resting negative charge, so they
will be ready to depolarize again.
29
QT Interval
- The QT Interval represents the duration of
ventricular systole (contraction of the
ventricles) and is measured from the beginning of
the QRS until the end of the T Wave.
30
The Cardiac Cycle
- The Cardiac Cycle is represented by the P Wave,
QRS Complex, the T Wave, and the baseline that
follows until another P Wave appears. This cycle
is repeated continuously.
31
The Cardiac Cycle
32
The Cardiac Cycle
- The P Wave represents atrial depolarization
(contraction). - The PR Segment represents the pause at the AV
Node. - The QRS Complex represents ventricular
depolarization (contraction). - The ST Segment represents the initial phase of
ventricular repolarization. - The T Wave represents the final, rapid phase of
ventricular repolarization.
33
EKG Paper
- The EKG is recorded on ruled (graph paper).
- The smallest divisions are 1 millimeter (mm)
squares. - The large black square has sides that are 5 mm
long.
34
EKG Paper
- The horizontal axis represents time.
- Each small box represents .04 seconds.
- Each large black box represents .2 seconds.
35
EKG Paper
- By measuring along the horizontal axis, we can
determine the duration of any part of the cardiac
cycle.
36
(No Transcript)
37
EKG Leads
- The standard EKG is composed of 12 separate leads
(or wires) that are attached to electrodes
(sensors). - There are 6 limb leads recorded by using arm and
leg electrodes. - There are 6 chest leads obtained by placing
electrodes at different positions on the chest.
38
EKG Leads
Limb Leads Chest Leads
I V1
II V2
III V3
AVR V4
AVL V5
AVF V6
39
EKG Lead Location
Leads What they are looking at
V1, V2 Right side of heart -Anterior Descending Artery
V3, V4 Septum between ventricles -Anterior Descending Artery
V5, V6, I, AVL Left (lateral) side of heart -Circumflex Artery
II, III, AVF Inferior part of heart -Right or Left Coronary Artery
40
Heart Rate
- When examining an EKG, you should first consider
the rate. - The rate is read as cycles per minute.
41
Heart Rate
- The SA Node is the hearts dominant pacemaker,
generating a sinus rhythm. - The SA Node paces at a resting rate range of 60
to 100 per minute.
42
Heart Rate
- When the SA Node paces the heart rate slower than
60 per minute, it is called Sinus Bradycardia. - When the SA Node paces the heart rate faster than
100 per minute, it is called Sinus Tachycardia.
43
Heart Rate
- Other potential pacemakers, known as ectopic foci
have the ability to pace the heart (at a slower
rate), if the normal SA Node pacemaking fails. - These foci are located in the
- -Atrial Foci rate of 60-80 per minute
- -Junctional Foci rate of 40-60 per minute
- -Ventricular Foci rate of 20-40 per minute
- Rapid pacemaking activity suppresses slower
activity
44
Determining the Heart Rate from an EKG
- Step 1
- -Find a specific R Wave that peaks on a
heavy black line (this will be the start line)
45
Determining the Heart Rate from an EKG
- Step 2
- -Count off 300, 150, 100 for every thick
black line that follows the start line, naming
each line as shown
46
Determining the Heart Rate from an EKG
- Step 3
- -Count off the next three lines after 300,
150, 100 as 75, 60, 50.
47
Determining the Heart Rate from an EKG
- Step 4
- -Where the next R Wave falls, determines the
heart rate. - -Its that simple!
48
Determining the Heart Rate from an EKG
What is this patients Heart Rate?
49
Determining the Heart Rate from an EKG
- In the previous EKG, the heart rate was 60, and P
Waves were absent. - Which ectopic foci acted as the pacemaker for
this case of bradycardia?
50
Determining the following Heart Rates
51
Determining the rhythm on an EKG
- The EKG provides the most accurate means of
identifying cardiac arrhythmias (abnormal
rhythms).
52
Determining the rhythm on an EKG
- On an EKG, there is a consistent distance
(duration) between similar waves during a normal
, regular cardiac rhythm. - This is due to the automaticity of the SA Node,
which maintains a constant cycle of pacing
impulses.
53
Determining the rhythm on an EKG
- An EKG is scanned for the repetitive continuity
of a regular rhythm. Breaks in the continuity,
such as a pause, presence of an early (premature)
beat, or sudden rate change warn us of a rhythm
disturbance.
54
Irregular Rhythms
- Wandering Pacemaker
- An irregular rhythm produced by the pacemaker
activity wandering from the SA Node to nearby
atrial foci. - This produces cycle length variation as well as
variation in the shape of the P Wave
55
Wandering Pacemaker
56
Multifocal Atrial Tachycardia
- Multifocal Atrial Tachycardia (MAT) is a rhythm
of patients with Chronic Obstructive Pulmonary
Disease (COPD). - The heart rate is over 100 bpm with P waves of
various shapes, since three or more atrial foci
are involved.
57
Multifocal Atrial Tachycardia
58
Atrial Fibrillation
- Atrial Fibrillation is caused by the continuous,
rapid firing of multiple atrial foci. Since no
single impulse depolarizes the atria completely,
and only one occasional atrial depolarization
gets through the AV Node to stimulate the
ventricles, an irregular ventricular rhythm is
produced.
59
Atrial Fibrillation
60
A
B
C
What is pacing the rhythm of EKG C?
61
Premature Beats
- Premature beats occur when an irritable foci
fires a single stimulus - Premature Atrial Contraction (PAC)
- Premature Ventricular Contraction (PVC)
62
Premature Atrial Contraction
- A Premature Atrial Contraction (PAC) originates
suddenly in an irritable atrial foci, and it
produces an abnormal P Wave earlier than
expected. - The abnormal P Wave leads to a QRS Complex that
occurs out of its normal rhythm.
63
Premature Atrial Contraction
64
Premature Ventricular Contraction
- A Premature Ventricular Contraction (PVC)
originates suddenly in an irritable ventricular
foci. - It produces a giant ventricular complex (big and
wide QRS)on the EKG. - There is no P Wave before the abnormal QRS
Complex, because the atria have not depolarized
(contracted).
65
Premature Ventricular Contraction
66
Tachyarrhythmias
- A Tachyarrhythmia originates in a very irritable
foci that paces rapidly. Sometimes more than one
active foci is generating the pacing stimuli. - Paroxysmal Tachycardia 150-250 bpm
- Flutter 250-350 bpm
- Fibrillation 350-450 bpm
67
First Degree AV Heart Block
- Normally, there is a pause at the AV Node, which
allows blood to enter the ventricles. - In First Degree AV Block, there is a longer than
normal pause before ventricular stimulation. - This is seen on an EKG as a PR Interval longer
than one large square (.2 Seconds).
68
Myocardial Infarction
- Myocardial Infarction (MI) results from the
complete occlusion of a coronary artery. - The area of the myocardium supplied by the
occluded coronary artery becomes non-viable and
neither depolarizes or contracts.
69
Myocardial Infarction
- The classic triad of myocardial infarction is
- Ischemia
- Injury
- Infarction
70
Myocardial Infarction
- Ischemia a decrease in blood supply from the
coronary arteries to the myocardium of the heart. - Characterized by inverted T Waves on the EKG
71
Myocardial Infarction
- Injury indicates the acuteness of an infarct.
- ST Elevation denotes myocardial injury.
72
Myocardial Infarction
- Infarction permanent damage to the myocardium is
called an infarction. - A Significant Q Wave is one that is at least 1
small square wide (.04 sec), or 1/3 the height
(or greater) of the QRS amplitude (Height). - Significant Q Waves indicate permanent damage to
the myocardium from a heart attack.
73
Myocardial Infarction
74
Myocardial Infarction
75
Myocardial Infarction
Recommended
