
PowerPoint-Pr PowerPoint PPT Presentation
Title: PowerPoint-Pr
1
Quantifying Carbon Uptake by Vegetation for
Europe on a 1km² Resolution
M. Tum, C. Seipp, M. Niklaus, K.P. Günther German
Aerospace Center (DLR), German Remote Sensing
Data Center (DFD)
Introduction During the last decades quantifying
sinks and sources of climatological relevant
trace gases as well as understanding their
exchanges between atmosphere and land surface,
have become essential research topics in
atmospheric science. Modelling the CO2 uptake by
vegetation via photosynthesis (Net Primary
Productivity, NPP) has become an important tool
to study the mechanisms of CO2 exchange. At the
German Aerospace Center (DLR) the Biosphere
Energy Transfer Hydrology (BETHY/DLR) vegetation
model is used to perform simulations of NPP over
Europe. The model is driven by remote sensing
data of the Leaf Area Index (LAI) and land cover
classification and meteorological data from the
European Center for Medium-Range Weather Forecast
(ECMWF). The model output is given as time series
of Gross Primary Productivity (GPP) and NPP on a
1km² resolution.
Methodology With this study we like to introduce
our upgraded version of the Biosphere Energy
Transfer Hydrology (BETHY/DLR) Model (Wißkirchen,
2005 Knorr, 1997), which is designed for
regional to continental applications. The model
was already validated for Germanys forests and
agricultural areas using empirical data (Tum and
Günther, 2011 Tum et al., 2011). As an example,
the annual NPP of forest, agriculture and
grassland areas in Europe for 2007 is shown in
Figure 1 with spatial resolution of 1 km². For
South-East Europe and especially for the
Mediterranean area the highest values are found.
Furthermore it is obvious that the NPP decreases
with latitude. In total Europes vegetation
accumulated 1320 Gt carbon in 2007. In order to
assess the quality of the model results time
series of estimated GPP from 83 European FLUXNET
tower sites are compared with modeled GPP for the
years 2000 to 2007. For each FLUXNET station we
used the level 4 product of calculated GPP given
as half hourly time series.
The distribution of the selected FLUXNET sites is
presented in figure 2, covering six different
vegetation types. We excluded all datasets with
less than two complete years of measurement.
Results As shown in figure 3 the modelled
monthly GPP corresponds in its general annual
course with the monthly eddy covariance
measurements. It is also evident from figure 3
that BETHY/DLR tends to show lower GPP than the
FLUXNET estimates. For most of the sites and
years we found differences in the monthly and
annual estimates of FLUXNET and modelled GPP
values, which might be due to an underestimation
of daytime respiration needed to calculate GPP
from the eddy covariance measurements. This
hypothesis is based on our findings that the
annual modelled NPP for both agriculture and
forest areas is highly correlated with
statistical field data (Tum and Günther, 2011).
Future investigations have to be carried out for
clarification.
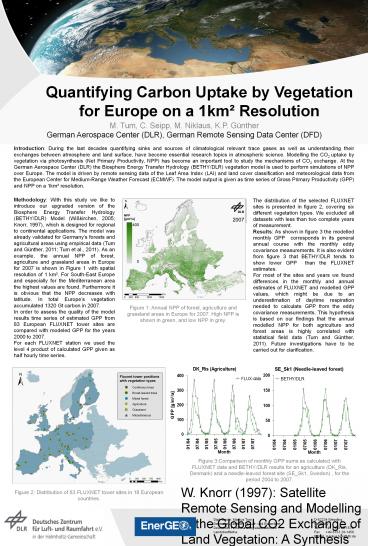
Figure 1 Annual NPP of forest, agriculture and
grassland areas in Europe for 2007. High NPP is
shown in green, and low NPP in grey.
Figure 3Comparison of monthly GPP sums as
calculated with FLUXNET data and BETHY/DLR
results for an agriculture (DK_Ris, Denmark) and
a needle-leaved forest site (SE_Sk1, Sweden) ,
for the period 2004 to 2007.
W. Knorr (1997) Satellite Remote Sensing and
Modelling of the Global CO2 Exchange of Land
Vegetation A Synthesis Study, Dissertation -
Faculty of Earth Sciences of the University of
Hamburg M. Tum and KP. Günther (2011) Validating
modelled NPP using statistical yield data.
Biomass and Bioenergy 354665-4674. M. Tum et al.
(2011) Validation of modelled forest biomass in
Germany using BETHY/DLR. Geoscientific Model
Development 41019-1034. K. Wißkirchen (2005)
Modellierung der regionalen CO2-Aufnahme durch
Vegetation, Dissertation - Mathematisch-Naturwisse
nschaftliche Fakultät der Rheinischen
Friedrich-Wilhelms Universität Bonn
Figure 2 Distribution of 83 FLUXNET tower sites
in 18 European countries.
Recommended
