
Equations, Tables, and Graphs PowerPoint PPT Presentation
1 / 9
Title: Equations, Tables, and Graphs
1
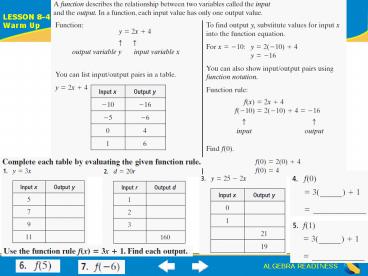
Lesson 8-4 Warm-Up
LESSON 8-4 Warm Up
2
Lesson 8-4 Warm-Up
LESSON 8-4 Warm Up
3
Graphing Linear Functions (8-4)
- To graph any function
- Make a function table (x y table) where the x
values (horizontal axis on the graph) are the
input values (also called independent values) and
the y values are the output (or dependent)
values. Make up your own x, or input values, and
find the y, or output values for those x values.
Write the x and y solutionsas ordered pairs. - Plot those (x, y) pairs and connect the points
together. - Example Graph y - x 12
- Substitute your own x (input) values
into the equation and find the corresponding
y values. - Write the solutions to the equations as
ordered pairs (x, y)
- How do you graph a linear (line) function?
1 3
4
Graphing Linear Functions (8-4)
- Plot the ordered pairs from your
function table.. - Connect the dots (a linear function in
which x is to the first power, or x1 will
form a line)
5
Graphing Linear Functions
LESSON 8-4
Additional Examples
Suppose you buy a bag of food for your dog
every week. Use the table below to make a graph
of the cost of the dog food.
Number of Weeks 1 2 3 4
Cost of Dog Food 4 8 12 16
6
Graphing Linear Functions
LESSON 8-4
Additional Examples
Graph the linear equation y x 3, where y
represents the pressure inside a deflating
balloon after x seconds.
Each point (x, y) on the graph represents a
solution of the equation. For example, the point
(1, 2) means that after 1 second the pressure
inside the balloon is 2 units of pressure.
7
Graphing Linear Functions
LESSON 8-4
Additional Examples
8
Graphing Linear Functions
LESSON 8-4
Additional Examples
Graph the function y x 2.
9
Graphing Linear Functions
LESSON 8-4
Lesson Quiz
1. Complete the table and graph the function
given the rule Output Input
(4). 2. Make a table and graph the
function y 1.
Recommended
