
History and Biogeography Self-replicating molecular assemblages Geological Past Shrinking, buckling Earth, Polarity Reversals Paleoclimatology: Milankovitch cycles Eustatic sea level changes Palynology (fossil pollen profiles) Radioisotope da - PowerPoint PPT Presentation
1 / 47
Title:
History and Biogeography Self-replicating molecular assemblages Geological Past Shrinking, buckling Earth, Polarity Reversals Paleoclimatology: Milankovitch cycles Eustatic sea level changes Palynology (fossil pollen profiles) Radioisotope da
Description:
Title: History and Biogeography Self-replicating molecular assemblages Geological Past Shrinking, buckling Earth, Polarity Reversals Paleoclimatology: Milankovitch ... – PowerPoint PPT presentation
Number of Views:214
Avg rating:3.0/5.0
Title: History and Biogeography Self-replicating molecular assemblages Geological Past Shrinking, buckling Earth, Polarity Reversals Paleoclimatology: Milankovitch cycles Eustatic sea level changes Palynology (fossil pollen profiles) Radioisotope da
1
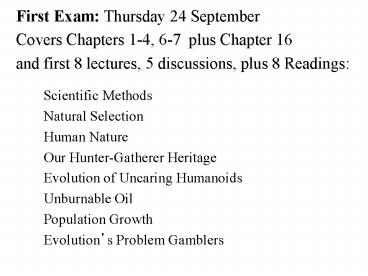
First Exam Thursday 24 September Covers Chapters
1-4, 6-7 plus Chapter 16 and first 8 lectures, 5
discussions, plus 8 Readings
Scientific Methods Natural Selection Human
Nature Our Hunter-Gatherer Heritage Evolution of
Uncaring Humanoids Unburnable Oil Population
Growth Evolutions Problem Gamblers
2
History and BiogeographySelf-replicating
molecular assemblagesGeological Past Shrinking,
buckling Earth, Polarity Reversals Paleoclimatolo
gy Milankovitch Cycles Precession, Obliquity,
and EccentricityEustatic sea level
changesPalynology (fossil pollen
profiles)Radioisotope dating (half life, C14
carbon 14, 5700 years)Geological time scale,
Boundaries marked by extinctionsChicxulub
Asteroid impact (iridium layer, 65
mya)Pleistocene MegafaunaOverkill
hypothesis Classical Biogeography, Wallaces
Line Continental drift, sea floor
spreading Foraminifera fossil record
3
2013 1824 ppb
Milankovitch Cycles Interglacials
C
2013 396 ppm
C
The Long Summer
C
C
C
4
Milankovitch Cycles
Obliquity Inclination varies from 22o to about
24.5o over a period of 41,000 years (also
called Axial Tilt) Eccentricity Shape of
Earth's orbit varies from elliptical to more
circular and back again -- longer complex
periodicities of 95, 125 and 400 thousand
years Precession Wobbling of the orbital axis
and movement of the orbital plane itself -- at
times, the Sun is closest to Earth during the
Summer Solstice, but it is now closest during
the Winter Solstice (perihelion) -- 19-24,000
years
5
Milankovitch Cycles Obliquity
6
Milankovitch Cycles
7
Milankovitch Cycles
Aphelion
Perihelion
Aphelion
Perihelion
8
2013 1824 ppb
Milankovitch Cycles Interglacials
C
2013 396 ppm
C
The Long Summer
C
C
C
9
Milankovitch Cycles
10
(No Transcript)
11
(No Transcript)
12
(No Transcript)
13
(No Transcript)
14
Meterology Climate versus Weather Sun,
Wind, Water Oceans/Atmosphere Temperature
Precipitation (rain, snow) Hydrologic
Cycle Watch Earths Water Cycle Greenhouse
Effect Thermal Equator Local Perturbations
15
Daylength (Photoperiod) changes seasonally, but
differently at different latitudes no change in
daylength at equator
16
Average Annual Temperature ( C)
at Different Latitudes___________________________
________________________________
Latitude
Year January July Range___________________
________________________________________
90N 22.7 41.1 1.1 40.080N 18.3 32.2
2.0 34.270N 10.7 26.3 7.3 33.660N
1.1 16.1 14.1 30.250N 5.8
7.1 18.1 25.240N 14.1 5.0 24.0 19.030N
20.4 14.5 27.3 12.820N 25.3 21.8 28.0
6.210N 26.7 25.8 27.2 1.4Equator 26.2
26.4 25.6 0.810S 25.3 26.3 23.9 2.420S
22.9 25.4 20.0 5.430S 16.6 21.9 14.7
7.240S 11.9 15.6 9.0 6.650S 5.8
8.1 3.4 4.760S 3.4 2.1
9.1 11.270S 13.6 3.5 23.0 19.580S 27.0
10.8 39.5 28.790S 33.1 13.5 47.8 34.3
17
Heat Energy intercepting Earths Surface at
various Latitudes
18
Heat Energy intercepting Earths Surface at
various Latitudes
19
Coriolis Force
20
Wind Currents during 2006-2007
Note Westerlies at high latitudes (Blue)
21
Ocean currents move heat to higher latitudes on
east coasts, and cold polar water towards the
equator on west coasts.
22
El Nino Ocean Currents move heat
23
(No Transcript)
24
(No Transcript)
25
La Nina
26
Walker Circulation El Nino-La Nina
27
NASA - Ocean Currents move heat - 2 years
Chicago
28
Meridional Circulation Patterns Atmospheric
Cells, Jet Streams, Adiabatic Cooling and
Warming, Horse Latitudes, Thermal Equator
29
Thermal Equator
Meridional Circulation Patterns Atmospheric
Cells, Jet Streams, Adiabatic Cooling and
Warming, Horse Latitudes, Thermal Equator
30
Thermal Equator
Meridional Circulation Patterns Atmospheric
Cells, Jet Streams, Adiabatic Cooling and
Warming, Horse Latitudes, Thermal Equator
31
(No Transcript)
32
Annual March of Average Monthly Precipitation (sea
sonal Patterns of Precipitation)
33
Watch Earths Water Cycle
34
Latitudinal Belts of Average Annual Precipitation
35
Geographic Distribution of Average Annual
Precipitation
36
Rainshadow Effect
37
(No Transcript)
38
Climographs Plot average Monthly
Temperature Against Average Monthly Precipitatio
n
39
(No Transcript)
40
Two plots of temperature against moisture. (a)
Climographs for an area in Montana where the
Hungarian partridge was introduced successfully
and a Missouri locality where its introduction
failed, compared to the average climatic
conditions of its European geographic range.
Apparently Missouri summers are too hot and/or
too wet for these birds. (b) Plots of temperature
versus relative humidity in 1927 and 1932 in
Israel superimposed on optimal (inner rectangle)
and favorable (outer rectangle) conditions for
the Mediterranean fruit fly.
41
World Net of Weather Stations
42
(No Transcript)
43
Geographic Distribution of Climates
44
Geographic Distribution of Climates
45
Distribution of Major Vegetation Types
46
Distribution of Major Vegetation Types
47
Biomes of the World Distribution of
Major Vegetation Types
Recommended
CrystalGraphics Presentations


