
The Period 4 transition metals PowerPoint PPT Presentation
1 / 33
Title: The Period 4 transition metals
1
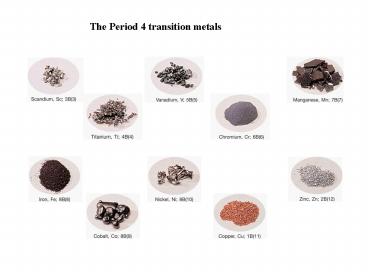
The Period 4 transition metals
2
Colors of representative compounds of the Period
4 transition metals
nickel(II) nitrate hexahydrate
sodium chromate
zinc sulfate heptahydrate
potassium ferricyanide
titanium oxide
scandium oxide
manganese(II) chloride tetrahydrate
copper(II) sulfate pentahydrate
vanadyl sulfate dihydrate
cobalt(II) chloride hexahydrate
3
Aqueous oxoanions of transition elements
One of the most characteristic chemical
properties of these elements is the occurrence of
multiple oxidation states.
4
Effects of the metal oxidation state and of
ligand identity on color
V(H2O)63
V(H2O)62
Cr(NH3)63
Cr(NH3)5Cl 2
5
Linkage isomers
6
An artists wheel
7
(No Transcript)
8
The five d-orbitals in an octahedral field of
ligands
9
Splitting of d-orbital energies by an octahedral
field of ligands
D is the splitting energy
10
The effect of ligand on splitting energy
11
Electronic Spectroscopy of Transition Metal
Complexes
Chemistry 412 Experiment 1
12
What is electronic spectroscopy?
Absorption of radiation leading to electronic
transitions within a molecule or complex
Absorption
Absorption
Ru(bpy)32
Ni(H2O)62
104
10
14 000
50 000
25 000
400
200
700
UV
visible
UV
visible
l / nm (wavelength)
UV higher energy transitions - between ligand
orbitals visible lower energy transitions -
between d-orbitals of transition metals -
between metal and ligand orbitals
13
- Absorption maxima in a visible spectrum have
three important characteristics - number (how many there are)
- This depends on the electron configuration of the
metal centre - 2. position (what wavelength/energy)
- This depends on the ligand field splitting
parameter, Doct or Dtet and on the degree of
inter-electron repulsion - intensity
- This depends on the "allowedness" of the
transitions which is described by two selection
rules
14
Energy of transitions
Excited State
molecular rotations lower energy (0.01 - 1 kJ
mol-1) microwave radiation
electron transitions higher energy (100 - 104 kJ
mol-1) visible and UV radiation
Ground State
molecular vibrations medium energy (1 - 120 kJ
mol-1) IR radiation
During an electronic transition the complex
absorbs energy electrons change orbital the
complex changes energy state
15
Absorption of light
Ti(OH2)63 d1 ion, octahedral complex
white light 400-800 nm
blue 400-490 nm yellow-green
490-580 nm red 580-700 nm
A
This complex is has a light purple colour in
solution because it absorbs green light
l / nm
lmax 510 nm
16
The energy of the absorption by Ti(OH2)63 is
the ligand-field splitting, Do
ES
ES
eg
eg
hn
Do
GS
GS
t2g
t2g
d-d transition
complex in electronic excited state (ES)
complex in electronic Ground State (GS)
Ti(OH2)63 lmax 510 nm Do is ? 243 kJ
mol-1 20 300 cm-1
An electron changes orbital the ion changes
energy state
17
Electron-electron repulsion
d2 ion
eg
eg
x2-y2
x2-y2
z2
z2
t2g
t2g
xy
xz
yz
xy
xz
yz
xy z2
xz z2
z
z
y
y
x
x
lobes overlap, large electron repulsion
lobes far apart, small electron repulsion
These two electron configurations do not have the
same energy
18
Which is the Ground State?
3P
States of the same spin multiplicity
D E
3F
D E 15 B
B is the Racah parameter and is a measure of
inter-electron repulsion within the whole ion
Relative strength of coupling interactions
19
Effect of a crystal field on the free ion term of
a d1 complex
d1 ? d6
tetrahedral field free ion octahedral field
2Eg
2T2
2D
2E
2T2g
20
Energy level diagram for d1 ions in an Oh field
2Eg
Energy
D
2D
2T2g
ligand field strength, Doct
For d6 ions in an Oh field, the splitting is the
same, but the multiplicity of the states is 5, ie
5Eg and 5T2g
21
Ti(OH2)63
d1 oct
2Eg
2Eg ? 2T2g
2D
2T2g
22
The Jahn-Teller Distortion Any non-linear
molecule in a degenerate electronic state will
undergo distortion to lower it's symmetry and
lift the degeneracy
Degenerate electronic ground state T or
E Non-degenerate ground state A
d3 4A2g d5 (high spin) 6A1g d6 (low
spin) 1A1g d8 3A2g
2B1g
A
2Eg
Ti(H2O)63, d1
2A1g
2T2g
30 000
20 000
10 000
23
Racah Parameters
Free ion Co2 B 971 cm-1
CoCl42-
Co(H2O)62
d7 tetrahedral complex 15 B' 10 900 cm-1 B'
727 cm-1
d7 octahedral complex 15 B' 13 800 cm-1 B'
920 cm-1
B' 0.95 B
B' 0.75 B
Nephelauxetic ratio, b
b is a measure of the decrease in
electron-electron repulsion on complexation
24
cloud expanding
- some covalency in M-L bonds M and L share
electrons - effective size of metal orbitals increases
- electron-electron repulsion decreases
Nephelauxetic series of ligands F- lt H2O lt NH3
lt en lt oxalate2- lt NCS- lt Cl- lt Br- lt
I- Nephelauxetic series of metal ions Mn(II) lt
Ni(II) Co(II) lt Mo(II) gt Re (IV) lt Fe(III) lt
Ir(III) lt Co(III) lt Mn(IV)
25
Selection Rules
Transition e complexes Spin forbidden 10-3
1 Many d5 Oh cxs Laporte forbidden Mn(OH2)62
Spin allowed Laporte forbidden 1 10 Many Oh
cxs Ni(OH2)62 10 100 Some square planar
cxs PdCl42- 100 1000 6-coordinate
complexes of low symmetry, many square planar
cxs particularly with organic ligands Spin
allowed 102 103 Some MLCT bands in cxs with
unsaturated ligands Laporte allowed 102
104 Acentric complexes with ligands such as acac,
or with P donor atoms 103 106 Many CT
bands, transitions in organic species
26
The Spectrochemical Series
eg
eg
I- lt Br- lt S2- lt SCN- lt Cl-lt NO3- lt F- lt OH- lt
ox2- lt H2O lt NCS- lt CH3CN lt NH3 lt en lt
bpy lt phen lt NO2- lt phosph lt CN- lt CO
D
D
t 2g
t 2g
weak field ligands e.g. H2O high spin complexes
strong field ligands e.g. CN- low spin complexes
The Spin Transition
27
d5
Tanabe-Sugano diagrams
4T2g
2A1g
E/B
4T1g
All terms included Ground state assigned to E
0 Higher levels drawn relative to GS Energy in
terms of B High-spin and low-spin configurations
4Eg
4T2g
4A1g, 4E
2A1g
2T1g
2T2g
2Eg
Critical value of D
4A2g, 2T1g
4T2g
6A1g
4T1g
2T2g
D/B
28
Tanabe-Sugano diagram for d2 ions
V(H2O)63 Three spin allowed transitions
E/B
n1 17 800 cm-1 visible n2 25 700
cm-1 visible n3 obscured by CT transition in UV
25 700 1.44 17 800
D/B
29
E/B
n1 17 800 cm-1 n2 25 700 cm-1
E/B 43 cm-1 E 25 700 cm-1 B 600 cm-1 Do /
B 32 Do 19 200 cm-1
30
Tanabe-Sugano diagram for d3 ions
n1 17 400 cm-1 visible n2 24 500
cm-1 visible n3 obscured by CT transition
Cr(H2O)63 Three spin allowed transitions
E/B
D/B 24
D/B
31
Calculating n3
n1 17 400 cm-1 n2 24 500 cm-1
E/B
When n1 E 17 400 cm-1 E/B 24 so B 725
cm-1
When n2 E 24 500 cm-1 E/B 34 so B 725
cm-1
If D/B 24 D 24 x 725 17 400 cm-1
D/B
24
32
d0 and d10 ions
d0 and d10 ion have no d-d transitions
white
Zn2 d10 ion
TiF4 d0 ion TiCl4 d0 ion TiBr4 d0 ion TiI4 d0
ion
white
white
orange
dark brown
MnO4- Mn(VII) d0 ion Cr2O7- Cr(VI) d0 ion
extremely purple
bright orange
Cu(MeCN)4 Cu(I) d10 ion Cu(phen)2
Cu(I) d10 ion
colourless
dark orange
33
Ligand-to-metal charge transfer LMCT transitions
Metal-to-ligand charge transfer MLCT transitions
Charge Transfer Transitions
Lp
eg
t2g
Md
Lp
Ls
Recommended
