
Quiz PowerPoint PPT Presentation
Title: Quiz
1
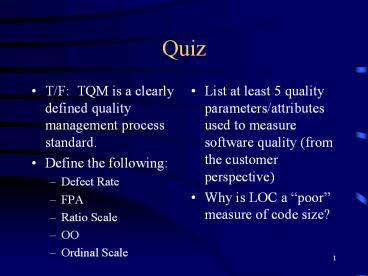
Quiz
- T/F TQM is a clearly defined quality management
process standard. - Define the following
- Defect Rate
- FPA
- Ratio Scale
- OO
- Ordinal Scale
- List at least 5 quality parameters/attributes
used to measure software quality (from the
customer perspective) - Why is LOC a poor measure of code size?
2
Project SampleOS X
- Project Replaced Carbon
- and NeXT and Yellow Box and...
- Developers
- Customers
- The Media
- iCEO
3
(No Transcript)
4
(No Transcript)
5
(No Transcript)
6
(No Transcript)
7
(No Transcript)
8
(No Transcript)
9
(No Transcript)
10
Software Quality EngineeringCS410
- Class 3a
- Measurement Theory
11
Measurement Theory
- It is an undisputed statement that measurement
is crucial to the progress of all sciences (Kan
1995) - Scientific progress is made through observations
and generalizations based on data and
measurements, the derivation of theories as a
result, and in turn the confirmation or
refutation of theories via hypothesis testing
(Kan 1995)
12
Measurement Theory
- Basic measurement theory steps
- Proposition
- an idea is proposed
- Definition
- components of the idea are defined
- Operational Definition
- operational characteristics of components are
identified - Metric definition
- metrics are identified based on operational
definition
13
Measurement Theory
- Hypothesis definitions
- hypotheses are drawn from combination of
proposition and definitions - Testing and metric gathering
- testing is performed and empirical data is
collected - Confirmation or refutation of hypothesis
- hypotheses are confirmed or refuted based on
analysis of empirical data
14
Measurement Theory
- Example
- Proposition - the more rigorous the front end of
the software development process is executed, the
better the quality at the back end - Definitions
- Front end SW process design through unit test
- Back end SW process integration through system
test - Rigorous implementation total adherence to
process (assume process designates 100 design
and code inspections)
15
Measurement Theory
- Operational Definitions
- Rigorous implementation can be measured by amount
of design inspection, and lines of code (LOC)
inspection - Back end quality means low number of defects
found in system test - Metric Definitions
- Design inspection coverage can be expressed as
percentage of designs inspected - LOC inspection coverage can be expressed as
percentage of LOC inspected - Back end quality can be expressed as defects per
thousand lines of code (KLOC)
16
Measurement Theory
- Hypothesis definition(s)
- The higher percentage of designs and code
inspected, the lower the defect rate will be at
system test. - Testing and metric gathering (multiple projects)
- Track and record inspection coverage
- Track and record defects found in system testing
- Confirmation or refutation of hypothesis
- Analyze data
- Hypothesis supported?
17
Measurement Theory
- The operationalization (definition) process
produces metrics and indicators for which data
can be collected, and the hypotheses can be
tested empirically. - In other words - You have to gather, analyze and
compare data to prove whether the hypothesis is
true or not.
18
Level of Measurement
- How measurements are classified and compared
- Nominal Scale
- Ordinal Scale
- Interval Scale
- Ratio Scale
- Scales are hierarchical, each higher level scale
posses all of the properties of the lower ones. - Operationalization should take advantage of
highest level scale possible (I.e. dont use
low/medium/high if you can use 110)
19
Level of Measurement
- Nominal Scale
- Lowest level scale
- Classification of items (sort items into
categories) - Two requirements
- Jointly exhaustive (all items can be categorized)
- Mutually exclusive (only one category applies)
- Names of categories and sequence order bear no
assumptions about relationships between
categories - Example
- Categories of SW dev Waterfall, Spiral,
Iterative, OO - Does not imply that Waterfall is better/greater
than Spiral
20
Level of Measurement
- Ordinal Scale
- Like nominal except comparison can be applied
- But - we cannot determine magnitude of difference
- Example
- Categories of SW dev orgs based on CMM levels
(1-5) - We can state that dev orgs at level 2 are more
mature then orgs at level 1, and so on... - But we cannot state how much better 2 is than 1,
or 3 is than 2, or 3 is than 1, and so on - Likert rating scale often used at with this scale
- 1 completely dissatisfied
- 2 somewhat dissatisfied
- 3 neutral
- 4 satisfied
- 5 completely satisfied
21
Level of Measurement
- Interval Scale
- Like ordinal scale, except now we can determine
exact differences between measurement points - Can use addition/subtraction expressions
- Requires establishment of a well-defined,
repeatable, unit of measurement - Example of interval scale
- Temperature in Fahrenheit (vs. cool, warm, hot)
- Day 1s high temperature was 80 degrees
- Day 2s high temperature was 87 degrees
- Day 2 was 7 degrees warmer than day 1 (addition)
- Day 1 was 7 degrees cooler than day 2
(subtraction)
22
Level of Measurement
- Ratio scale
- Interval scale with absolute, non-arbitrary zero
point - Highest level scale
- Can use multiplication and division
- Example
- MBNQA scores
- Company A scored 800 in the range of 0...1000
- Company B scored 400 in the range of 01000
- Company A doubled company Bs score
(multiplication) - Company B scored half as well as Company A
(division)
23
Basic Measures
- Measures are ways of analyzing and comparing data
to extract meaningful information. - Data vs. Information
- Data - raw numbers or facts
- Information
- relevant - related to subject
- qualified - characteristics specified
- reliable - dependable, high confidence level
- Basic measures
- Ratio
- Proportion
- Percentage
- Rate
24
Basic Measures
- Ratio
- Result of dividing one quantity by another
- Best use is with two distinct groups
- Numerator, denominator are mutually exclusive
- Examples 1
- Developers 10, Testers 5
- Developer to Tester ratio 10 / 5 x 100 200
- Example 2
- Developers 5, Testers 10
- Developer to Tester ratio 5 / 10 x 100 50
25
Basic Measures
- Proportion
- Best use is with multiple categories within one
group - For n categories (C) in the group (G) then
- C1/G C2/G Cn/G 1
- P of category desired category / total group
size - Example
- Number of customers surveyed 50
- Number of satisfied customers 30
- Proportion of satisfied customers 30 / 50 or .6
- Proportion of unsatisfied customers 20 / 50 or
.4 - satisfied (.6) plus unsatisfied (.4) 1
26
Basic Measures
- Percentage
- A proportion expressed in terms of per hundred
units - Percentages represent relative frequencies
- Total number of cases should always be included
- Total number of cases should be sufficiently
large - Example
- 200 bugs found in 8 KLOC
- 30 requirements bugs (30 / 200 x 100) 15
- 50 design bugs (50 / 200 x 100) 25
- 100 code bugs (100 / 200 x 100) 50
- 20 other bugs (20 / 200 x 100) 10
27
Basic Measures
- Rate
- Associated with dynamic changes of a quantity
over time - Changes in y per each unit of x
- x is usually a quantity of time
- time unit of x must be expressed
- Example
- Opportunity For Error 5000 (1. based on 5KLOC)
- Number of defects 200 (2. after one year)
- Defect rate 200 / 5000 1K 40 defects per
KLOC - Notes
- 1. - extremely had to determine OFE
- 2. - hard to know when to measure
28
Basic Measures
- Rate
- Six Sigma
- A specific defect rate of 3.4 defective parts per
million (ppm) which has become an industry
standard for the ultimate quality goal. - Sigma is the Greek symbol for standard deviation
- By definition, if the variations in the process
are reduced then its easier to obtain Six Sigma
quality - Some problems arise in SW engineering
- What are the parts
- lines of source code?
- lines of assembly code?
29
Reliability
- Reliability - consistency of a number of
measurements taken using the same measurement
method on the same subject - High degree of reliability - repeated
measurements are consistant - Low degree of reliability - repeated measurements
have large variations - Operational definitions (specifics of how
measurement is taken) are key to achieving high
degrees of reliability
30
Validity
- Validity is whether the measurement really
measures what is intended to be measured - Construct Validity - validity of a metric to
represent a theory - Difficult to validate abstract concepts
- Example
- Concept - Intelligent people attend college
- Measurement - Sum college enrollment
- Conclusion - The sum of the college enrollment
is the number of intelligent people - Not valid
31
Validity
- Criterion-related (predictive) Validity -
validity of a metric to predict a theory or
relationship - Example
- Concept - Safe driving requires knowledge of the
rules and regulations - Measurement - Drivers license test
- Conclusion - Those that have low scores on
drivers license tests are more likely to have an
accident - Content Validity - the degree to which a metric
covers the meaning of the concept - Example - A general math knowledge test needs to
include more than just addition and subtraction.
32
Measurement Errors
- Two types of measurement Errors
- Systematic Errors - errors associated with
validity - Random Errors - errors associated with
reliability - Example
- A bathroom scale which is off by 10 pounds
- Each time scale is used the reading equals
- actual weight 10 pounds variation
- true systematic error random error
- systematic error makes reading invalid
- random error makes reading unreliable
33
Measurement Errors
- Ways of assessing Reliability
- Test/Restest - one or more retests are performed
and results compared to previous tests - May expose random errors
- Alternative-form - acquire same measurements
using alternate testing means - May expose systematic errors
34
Correlation
- Correlation - a statistical method for assessing
relationships among observed or empirical data
sets - If the correlation coefficient between two
variables is weak, then there is no linear
correlation (but there may be non-linear) - Example - negative linear relationship between
LOC inspected and defects shipped
35
Causality
- Identification of cause and effect relationships
in experiments - Three criteria for cause-effect
- 1. Cause must precede effect
- 2. Two variables are empirically related
(relationship can be measured) - 3. Empirical relationship is direct (not
coincidence, or in error)
36
Summary
- Operational definitions are valuable in
determining levels and types of metrics to use - Scales and measures have different
characteristics and different intended uses - Avoid using the wrong scale or measure
- Validity and Reliability represent measurement
quality - Correlation and Causality are goals of
measurement (I.e. quest to identify and prove a
cause-effect relationship)
37
Follow-up
- List at least 5 quality parameters/attributes
used to measure software quality from the
customer perspective
38
Pop Quiz
- What is the difference between validity and
reliability? - Why are software development process models
important to the study of software quality? - Define Six Sigma
- Define MTTF
- T/F Defect density and PUM combined represent a
true measure of customer satisfaction. - T/F If a hypothesis is refuted, then the wrong
metrics were used.
39
Software Quality EngineeringCS410
- Class 3b
- Product Quality Metrics
- Process Quality Metrics
- Function Point analysis
40
Software Quality Metrics
- Three kinds of Software Quality Metrics
- Product Metrics - describe the characteristics of
product - size, complexity, design features, performance,
and quality level - Process Metrics - used for improving software
development/maintenance process - effectiveness of defect removal, pattern of
testing defect arrival, and response time of
fixes - Project Metrics - describe the project
characteristics and execution - number of developers, cost, schedule,
productivity, etc. - fairly straight forward
41
Software Quality Metrics
- Product Metrics
- Mean Time to Failure (MTTF)
- Defect Density
- Problems per User Month (PUM)
- Customer Satisfaction
- Process Project Metrics
- Defect density during machine testing
- Defect arrival patterns during machine testing
- Phased-based defect removal
- Defect removal effectiveness
42
Software Quality Metrics
- Some terminology
- Error - a human mistake that results in incorrect
(or incomplete) software - faulty requirement, design flaw, coding error
- Fault (a.k.a. defect) - a condition within the
system that causes a unit of the system to not
function properly - GPF, Abend, crash, lock-up, dead-lock, error
message, etc. - Failure - required function (I.e. the goal)
cannot be performed - An error results in a fault which may cause one
or more failures.
43
MTTF
- Mean Time To Failure (MTTF) - measures how long
the software can run before it encounters a
crash - Difficult measurement to obtain because its tied
to the real use of the product - Easier to define requirements for special purpose
software than general use software - MTTF is not widely used by commercial software
developers for these reasons
44
Defect Density
- Defect Density (a.k.a. Defect Rate) - is the
number of estimated defects - Estimated because defects are found throughout
the entire life-cycle of the product - Important for cost and resource estimates for the
maintenance phase of the life cycle
45
Defect Density
- More specific
- Defect Density (rate) number of defects /
opportunities for errors during a specified time - Number of defects can be approximated as equal to
the number of unique causes of observed failures - Opportunities for error can be expressed as KLOC
- Time frame (life of product or LOP) varies
46
Defect Density
- Defect Density Example
- Product is one year old, and is 10 KLOC
- Unique causes of observed failures 50
- Current Defect Density 50/10K x 1K 5 defects
per KLOC per year - After second year
- Unique causes of observed failures 75
- Current Defect Density 75 / 10K x 1K
7.5 defects per KLOC per
2year or 3.75 per
KLOC per year
47
Defect Density
- Comparison Issues
- How LOC is calculated
- Count only executable lines
- Note - what is an executable line?? HLL vs.
Assembler - Count executable lines, plus data definitions
- Count executable lines, plus data definitions,
plus comments - Count executable lines, plus data definitions,
plus comments, plus job control language - Count physical lines
- Count logical lines (terminated by )
- Function Point Analysis (FPA) is an alternative
measure of program size
48
Defect Density
- Comparison Issues (cont.)
- Timeframes must be the same
- Cannot compare (current) defect rate for a one
year old product to the (current) defect rate of
a four year old product - IBM considers life of product to be 4 years
- Must account for new and modified code in LOC
count (otherwise metric is skewed) - LOC counting must remain consistent
- Defect rate should be calculated for each release
(must use change flags)
49
Defect Density
- Change Flags Example
- / Module A - Prolog /
- / Release 1.1 modifications 12/01/97 _at_R11 /
- / Fix for problem report 1127 03/15/98 _at_F1127
/ - ...
- Total_Records 0 / Init records _at_R11A
/ - ...
- Bad_Records Total_Records - Good_Records
/ Calculate num bad recs _at_F1127C / - Flags (a.k.a. Change Control) - CMM level 2
- A - line added by release/fix
- C - line changed by release/fix
- M - line moved by release/fix
- D - line deleted by release/fix (optional)
50
Defect Density
- IBM Example
- SSI (current release) SSI (previous release)
- CSI - Deleted - Changed
- SSI - Shipped Source Instructions
- CSI - Changed (and new) Source Instructions
- Defect Rate Metrics for Current Release
- TVUA/KSSI - all APARS (defects) reported on the
total release (inclusive of previous release) - TVUA/KCSI - all APARS (defects) reported on the
new release code - APAR - Authorized Program Analysis Report
(Severity 1-4) - TVUA - Total Valid Unique Apars
51
Customer Problem Metrics
- In addition to valid defects, other issues are
viewed as problems by customers - Usability
- Unclear documentation/information
- Missing documentation/information
- Duplicate problems (counted as invalid)
- User errors (traps)
52
Customer Problem Metrics
- From customers perspective, the total problem
space is the combination of the defect-oriented
problems and the non-defect-oriented problems.
They all impact the customer, regardless of how
the SW company classifies them. - Total problems can be expressed as Problems per
User Month (PUM) - PUM Total Problems / License-Months
- License-Months Total number of licenses x
number of months in calculation period
53
Customer Problem Metrics
- PUM example
- Total defects 75, Licenses 50, Months 6
- PUM 75 / (50 x 6) .25 problems/user month
- PUM is usually calculated for each month after a
software release, and averaged for the year. - Note - PUM counts a defect multiple times,
depending on how pervasive it is (I.e. mainstream
function defects are costly) - Ways to lower PUM
- Improve the development process to reduce defects
- Reduce non-defect-oriented problems (better
documentation, usability, etc.) - Increase the number of licenses (?!)
54
Customer Satisfaction
- PUM and Defect Rate are not true measurements of
customer satisfaction, but they do contribute. - Timing, availability, company image, services,
and (customized) customer solutions also
contribute. - Customer satisfaction is usually measured using
the five point (Likert scale), via a customer
survey - 1. - Very dissatisfied
- 2. - Dissatisfied
- 3. - Neutral
- 4. - Satisfied
- 5. - Very satisfied
55
Customer Satisfaction
- Common metrics for Customer Satisfaction
- Percent of very satisfied customers
- Percent of satisfied customers (very satisfied
and satisfied) - Percent of dissatisfied customers (dissatisfied
and very dissatisfied) - Percent of non-satisfied (neutral, dissatisfied,
and very dissatisfied) - Scope of three quality metrics (defects, customer
problems, customer satisfaction). Fig. 4.1 p. 94
56
Defect Density During Machine Testing
- Machine Testing - testing after code is
integrated into the system library (I.e.
integration testing, function testing, system
testing, regression testing) - Commonly held beliefs
- There is a positive correlation between defect
rates found during testing and the number of
defects injected during development. - There is a positive correlation between the
defect rates found during testing and the defect
rate once product is released. - Counter argument Better testing will uncover
more defects (I.e. maybe the code is just being
tested better)
57
Defect Density During Machine Testing
- Release quality
- If defect rate during testing is the same or
lower than previous release then - If current release testing is worse then
- testing needs to be improved (inconclusive about
quality) - Else if release testing is the same (or better)
- the quality is better than previous release
- If defect rate during testing is higher than
previous release then - If testing process was improved then
- the quality is the same or better then previous
release - Else if testing process was not improved then
- the quality is worse than previous release (more
defects)
58
Defect Arrival Rate During Machine Testing
- Defect arrival rate provides more information to
supplement the defect density metric - This metric is a view of the patterns and time
between defects. - Different arrival patterns (can) indicate
different quality levels in the software. - Objective - to see declining and stabilizing
arrival rates over time - Supports the idea of shake-out testing where
you attempt to find all the highest level bugs
first so that additional testing is not impacted.
59
Defect Arrival Rate During Machine Testing
- Three different metrics for arrival rate
- Raw defect (includes duplicates, and invalids)
arrivals during testing phase per some time
interval (day, week, month, etc). - Valid defect arrivals during testing phase per
some time interval - Defect backlog over time. This is a measure of
workload which could adversely affect quality.
60
Phased-Based Defect Removal Pattern
- An extension of defect density metric.
- Defects are tracked at all (inspection/test)
phases of development cycle (design reviews, code
reviews, unit test, integration test, function
test, and system test). - This metric can be correlated to inspection
coverage, and test coverage metrics. - Helps to identify the overall defect removal
ability of the development process. - Fig. 4.3 p. 103
61
Defect Removal Effectiveness
- Defect Removal Effectiveness (DRE)
- DRE (Defects removed in the phase / defects
latent in product) x 100 - Where the latent defects can be calculated as the
sum of all defects found in later phases, and the
field (this is a constantly changing number)
62
Defect Removal Effectiveness
- Example - Defects per phase
- HLD (I0) review I0 5
- (found 5, latent4, total9), DRE(5/9x100)55
- LLD (I1) review I0 3, I1 4
- (found 4, latent6, total10),
DRE(4/10x100)40 - Code inspection (I2) I0 1, I1 1, I2 10
- (found 10, latent6, total16),
DRE(6/16x100)38 - Unit Test (UT) I0 0, I1 1, I2 5, UT 3
- (found 3, latent1, total4), DRE (3/4x100)
75 - Component Test (CT) I0 0, I1 0, I2 1, UT
1, CT 3 - (found 3, latent1, total4), DRE(3/4x100)
75 - System Test (ST) I0 0, I1 0, I2 0, UT 0,
CT 1, ST 2 - (found 2, latent1, total3), DRE (2/3x100)
67 - Field 2 I0 0, I1 0, I2 0, UT 0, CT
0, ST 1
63
Defect Removal Effectiveness
- Example - Defects per phase
- HLD (I0) review I0 5
- (found 5, latent4, total9), DRE(5/9x100)55
- LLD (I1) review I0 3, I1 4
- (found 4, latent6, total10),
DRE(4/10x100)40 - Code inspection (I2) I0 1, I1 1, I2 10
- (found 10, latent6, total16),
DRE(10/16x100)62.5 - Unit Test (UT) I0 0, I1 1, I2 5, UT 3
- (found 3, latent1, total4), DRE (3/4x100)
75 - Component Test (CT) I0 0, I1 0, I2 1, UT
1, CT 3 - (found 3, latent1, total4), DRE(3/4x100)
75 - System Test (ST) I0 0, I1 0, I2 0, UT 0,
CT 1, ST 2 - (found 2, latent1, total3), DRE (2/3x100)
67 - Field 2 I0 0, I1 0, I2 0, UT 0, CT
0, ST 1
Found
Latent
64
Defect Removal Effectiveness
- Notes
- Must account for where a defect was introduced.
- As number of field bugs increases DRE must be
recalculated. - Latent - present but not evident (at this phase).
65
Function Point Analysis (FPA)
- Alternative size measure to LOC
- Can measure productivity (function points per
person), and quality (defects per function point) - Idea The defect rate should be measured against
how many functions the software provides - Functionality is independent of code size
66
Function Point Analysis (FPA)
- Function Points is a weighted total of five major
components - External inputs x 4
- External outputs x 5
- Logical internal files x 10
- External interface files x 7
- External inquiries x 4
67
Function Point Analysis (FPA)
- Low and high weighting factors are used to
account for complexity - External inputs, low 3, high 6
- External outputs, low 4, high 7
- Logical internal files, low 7, high 15
- External interface files, low 5, high 10
- External inquiries, low 3, high 6
- Function Count (FC) is then calculated
- FC sum of each component
68
Function Point Analysis (FPA)14 system
characteristics are then accessed for impact on
scale of 0 to 5
- 7. End-user efficiency
- 8. On-line update
- 9. Complex processing
- 10. Reusability
- 11. Installation ease
- 12. Operational ease
- 13. Multiple sites
- 14. Facilitation of change
- 1. Data communications
- 2. Distributed functions
- 3. Performance
- 4. Heavily used configuration
- 5. Transaction rate
- 6. On-line data entry
69
Function Point Analysis (FPA)
- Value Adjustment Factor (VAF) then calculated
(a.k.a Processing Complexity Adjustment) - VAF 0.65 (0.01 x C)
- where C the sum of all the complexity ratings
- Then Function Points (FP) are calculated
- FP FC x VAF
- The resulting value is the function point rating
for the software. This number can also be used
to convert to a LOC rating for comparison reasons.
70
Summary
- Product Quality Metrics - focus on quality
aspects of product, both intrinsic and from
customer view point - Mean Time To Failure
- Defect Density
- Problems per User Month
- Customer Satisfaction
71
Summary (cont.)
- Process quality metrics - focus on quality and
effectiveness of the process. - Defect density during machine testing
- Defect arrival rate during machine testing
- Phased based defect removal
- Defect removal effectiveness
- Function Point analysis
- An alternative method to LOC counting
Recommended
