
. . . the Good, the Bad, and the Ugly! - PowerPoint PPT Presentation
Title: . . . the Good, the Bad, and the Ugly!
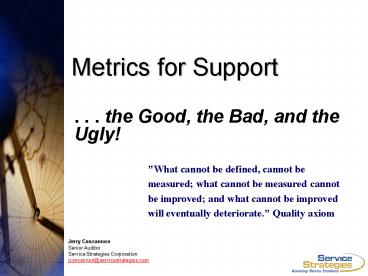
1
Metrics for Support
- . . . the Good, the Bad, and the Ugly!
"What cannot be defined, cannot be measured what
cannot be measured cannot be improved and what
cannot be improved will eventually deteriorate."
Quality axiom
Jerry Concannon Senior Auditor Service Strategies
Corporation jconcannon_at_servicestrategies.com
2
Commonly Found Metrics
- Customer Sat Event Survey
- Customer Sat Periodic Survey
- Response Time
- Initial Callback Response Time
- Resolve Time
- Customer Hold Time
- First Contact Resolution
- Customer Abandon Rate
- Call Monitoring Performance
- Mystery Shopper Results
- Calls closed within (parameter e.g. Day, 4
hours, 8 hours etc.) - Severity Level
- Calls
- Escalated
- Time to defect / escalation
- Percent escalated with actual defect
- Electronic Support Request Acknowledgement
- Electronic Support Response Time
- Cost per Case
- total
- labor
- non-labor
- Staff Productivity Measures
- Financial Management
- Overall Satisfaction
- Buy Again Rating
- Recommend to others
- Accuracy of reviewed solutions
- Access to Solution Knowledgebase
- Customer
- Support Agent
- Recall Rate
SCP Requirement
3
The Good . . .
- Measure performance relative to all strategic
goals. - Measure processes correlated to the delivery of
strategic results. - Are derived from solid baseline data.
- Are balanced e.g. (Balanced Scorecard).
- Hold people personally accountable for results.
4
Strategic Relevance
- In their recent book The Strategy-Focused
Organization, Kaplan and Norton note that,
according to an abundance of research data - Only 5 of the workforce understand their
company's strategy. - Only 25 of managers have incentives linked to
strategy. - 60 of organizations don't link budgets to
strategy. - 85 of executive teams spend less than one hour
per month discussing strategy.
Also authors of The Balance Scorecard and
Strategy Maps.
5
The Support Strategy Profit Continuum
6
Strategic Themes for Support
- Strategic Themes For Support should be based on a
few selected key value-creating processes. - Operations Management (e.g. producing and
delivering Support Solutions, Managing Knowledge
etc.). - Customer Management (Customer relevant attributes
of your Service Product). - Innovation of products and processes (such as
Product-Lifecycle Management, Product
Enhancements etc.) - Change and Evolution (conforming to
regulations, societal expectations, platform
enhancements, etc.)
7
Correlation
- Excels CORREL( ) function returns the
correlation coefficient for two ranges of data.
The syntax of the function is - CORREL(range1, range2) where range1 and range2
are data sets with the same number of elements.
- The correlation coefficient determines the degree
of linear association between data sets. - A value of 1 means there is a perfect positive
linear relationship between the data - A value of 0 indicates there is no linear
relationship between the data - A value of -1 represents a perfect negative
linear relationship.
8
What Is The Balanced Scorecard?
- The balanced scorecard is a 4-pillared management
system to help a business focus on - achieving financial results while at the same
time - creating future value through strategic
activities. - It translates mission and strategy into four
dimensions -- customer, financial, internal
processes, and innovation and learning-- and
seeks measures for them.
9
In this book, the four dimensions of strategy are
"Financial, Customer, Operations, and Innovation
and Learning". The authors strongly believe that
there should be a powerful connection between
these four dimensions if organizations are to be
successful in an environment in which stiff
competition dominates. According to the authors,
one of the most important causes of business
failure is that some companies place an excess
emphasis on financial objectives and ignore the
ways to realize these objectives. This book
explains how to develop a system which places an
equal emphasis on four dimensions of strategy
mentioned above. For managers who want to learn
how to make a plan that will be functional and
measurable, this book is a must.
10
- This book explains how an organization can
measure and manage performance with the Balanced
Scorecard methodology. It provides extensive
background on performance management and the
Balanced Scorecard, and focuses on guiding a team
through the step-by-step development and ongoing
implementation of a Balanced Scorecard system.
Corporations, public sector agencies, and not for
profit organizations have all reaped success from
the Balanced Scorecard. This book supplies
detailed implementation advice that is readily
applied to any and all of these organization
types.
11
More than a decade ago, Robert S. Kaplan and
David P. Norton introduced the Balanced
Scorecard, a revolutionary performance
measurement system that allowed organizations to
quantify intangible assets such as people,
information, and customer relationships. Now,
using their ongoing research with hundreds of
Balanced Scorecard adopters across the globe, the
authors have created a powerful new tool - The
Strategy Map - that enables companies to describe
the links between intangible assets and value
creation with a clarity and precision never
before possible. Kaplan and Norton argue that the
most critical aspect of strategy -implementing it
in a way that ensures sustained value creation -
depends on managing four key internal processes
operations, customer relationships, innovation,
and regulatory and social processes. The authors
show how companies can use strategy maps to link
those processes to desired outcomes evaluate,
measure, and improve the processes most critical
to success and target investments in human,
informational, and organizational
capital. Providing a visual epiphany for
executives everywhere who can't figure out why
their strategy isn't working, Strategy Maps is a
blueprint any organization can follow to align
processes, people, and information technology for
superior performance.
12
(No Transcript)
13
The Four Measurement Categories
- CUSTOMER KNOWLEDGE How do we become our
customers most valued supplier? - FINANCIAL PERFORMANCE How do we look to
shareholders? - INTERNAL BUSINESS PROCESSES What processes must
we excel at to achieve our objectives? - INNOVATION AND LEARNING How can we continue to
improve and create value with employees,
customers, and processes?
14
SMART metrics
One of the most popular characterizations of
indicators is the one known as SMART metric
(Ref. The Basics of Performance Measurement, J.L.
Harbour, Productivity Press, 1997)
- Specific
- - direct, unambiguous and targeted to the area
you are measuring. - Measurable
- - economical collection of data that is true,
accurate and complete . - Actionable
- - clearly delineates good results and bad
results, can show a trend (so that can be
pro-active). - Relevant
- - measures important things. A common downfall
of support centers is to measure everything that
is measurable, which produces many trivial or
pointless measures. - Timely
- - is responsive to change, data available when
you need it, enables timely feedback on actions
taken.
15
Primary Metric Categories
- Metrics generally fall into two categories
- Results Metrics typically measure what you are
doing. They are typically tied to outputs,
customer requirements, and strategic business
requirements. - e.g. customer satisfaction, gross support profit
- Process Metrics typically measure how you are
doing things. They tend to be internally focused
and are usually measures of compliance to key
strategic processes within an organization. - e.g. case escalation process adherence, cases
added to knowledge base per month
- Common mistakes
- Primarily focusing on process measures -
measuring yourself internally, rather than
beginning with an external focus, namely your
customer. - Primarily focusing on financial measures
measuring only things that directly impact the
bottom line, rather than having a balanced set of
metrics that allow you to measure the overall
effectiveness and sustainability of the operation.
16
The Bad and the Ugly . . .
- Average Customer Satisfaction Scores
- Average Time Metrics
- Analysis Paralysis and/or Trivial Metrics
17
Tyranny of Averages of Customer Satisfaction
Scores
4 5 are considered satisfied.
Bad Even when using a fully-anchored ordinal
scale, we are averaging results from different
people who have different perceptions of the
interval between each point on the rating
scale. Worse This is compounded if the scale is
not anchored to the extent that we are also
averaging different perceptions of the
definitions of each point on the ordinal
scale. Questionable When a respondent is asked to
rate the importance of something on an ordinal
scale, then to rate their satisfaction with that
something on another ordinal scale and then
somehow the difference between these two averages
is used on yet another ordinal scale to determine
the relative need for change or action.
Both Average 3.0.
18
Measures of time . . .
- Since we cant have negative time, measures of
time start at 0 and move forward. - While durations cant go below 0, they can go
quite long, unless constrained. - So the model for the distribution of time based
measures has to start at 0 and move toward
infinity.
19
Exponential Distribution Model
Exponential Distribution of Resolve Times if
average is 5 hours.
20
Examples of time based events that typically
occur according to an exponential distributions .
.
- The time between accidents at a specific
intersection - The the time from now until you have your next
car accident (since the Exponential Distribution
is memory-less) - The time until you get your next phone call
- The distance between roadkill
- The time until there is a breakdown in an
assembly line. - The lifetime of a light-bulb, toaster,
refrigerator, or any other useful object - The time until the arrival of the next customer
to a given business - The time until the arrival of the next customer
case to a support center.
21
Tyranny of Averages Support Metrics
For support metrics such as resolution time, hold
time, and the average speed to answer example
shown above, it is more accurate and actionable
to set a target for support metrics and measure
the percent that meets this target against the
desired percent. In many cases not only are the
averages problematical but a single outlier, such
as a call that isnt answered for 10 minutes, can
throw an entire day or maybe even a week of data
out of line with operational trends and can even
result in significant wasted management and
analysis time.
22
Analysis Paralysis and/or Trivial Metrics . . .
- Having too many metrics is almost as bad as not
having any. Some Support organizations have a
myriad of metrics that measure everything no
matter how trivial, every activity, result and
process in the Support Center. They generate a
false sense of security and exhibit the
simplistic belief that the more metrics they have
the better their decision making process will be.
- Avoid this temptation
- Limit the number of Metrics in the Support
Operation - Organize them strategically Balanced Scorecard
pillar.
23
Open Discussion
- Thank you!
Recommended
CrystalGraphics Presentations


