
Graphs PowerPoint PPT Presentation
1 / 12
Title: Graphs
1
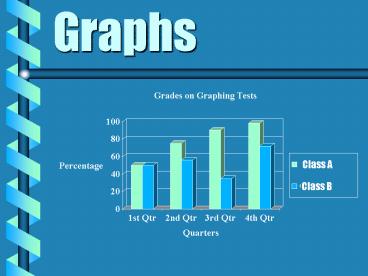
Graphs
Class A
Class B
2
Box - and - Whisker Plot
Circle Graph
Pictograph
Types of Graphs
Bar Graphs
Plots
Line Graphs
Histogram
Stem Leaf
Single
Single
Line
Double
Double
Scatter
3
Bar Graph
More Info
4
Double Bar Graph
More Info
5
Line Graph
More Info
6
Double Line Graph
More Info
7
Circle Graph
More Info
8
1. Bar Graph
Return to Graph
- The purpose of a bar graph is to display and
compare data. - Bar graphs use bars to show the data.
- A bar graph must include
- - a title
- - labeled X and Y axes
- - equal intervals are used on the Y axis
- - the bars are evenly spaced apart from each
other
9
3. Line Graph
Return to Graph
- A line graph is used to illustrate change over
time. - Line graphs need
- - Title
- - Labeled X and Y axes
- - Equal Intervals
- - Data displayed by points connected by
lines
10
4. Double Line Graph
Return to Graph
- - Equal Intervals
- - Data displayed by points connected into lines
- - Graph does need a Key
- A double line graph is used to compare two sets
of related data over time. - Double line graphs need
- - Title
- - Labeled X and Y axes
11
5. Circle Graph
Return to Graph
- Circle graphs are used to display parts of the
data in relation to the entire amount of data. - All circle graphs need a title.
- Each part is called a sector and is labeled.
- All angles correct
- Include a key
12
2. Double Bar Graph
Return to Graph
- The purpose of a double bar graph is to compare
two or more sets of data. - Uses bars to show the data.
- Double bar graphs must include
- - Title
- - Labeled X and Y axes
- - Equal intervals are used on the Y axis
- - Pairs of bars are equally spaced, but the
compared bars are not - - Must have a Key
Recommended
