
CTS: Clinical Assessment of COPD PowerPoint PPT Presentation
Title: CTS: Clinical Assessment of COPD
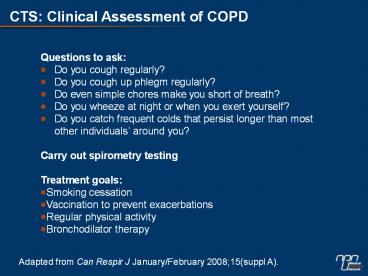
1
CTS Clinical Assessment of COPD
Questions to ask
Do you cough regularly? Do you cough up phlegm regularly? Do even simple chores make you short of breath? Do you wheeze at night or when you exert yourself? Do you catch frequent colds that persist longer than most other individuals around you?
Carry out spirometry testing
Treatment goals Smoking cessation Vaccination to prevent exacerbations Regular physical activity Bronchodilator therapy
Adapted from Can Respir J January/February
200815(suppl A).
2
CTS Potential Prevention Strategies for AECOPD
Smoking cessation
Vaccinations Influenza (annually) Pneumococcal vaccine (every five to 10 years)
Self-management education
Regular therapy with ICS/LABA combination (for moderate to severe COPD with 1 AECOPD on average per year)
Oral corticosteroid therapy for AECOPD
Pulmonary rehabilitation
Adapted from Can Respir J January/February
200815(suppl A).
3
CTS Comprehensive Approach to COPD/AECOPD
Management
Surgery
Oxygen
Inhaled corticosteroids/LABA
Pulmonary rehabilitation
Long-acting bronchodilator(s)
PRN short-acting bronchodilator(s)
Smoking cessation/exercise/self-management/educati
on
Very severe
Mild
Lung function impairment
II
V
MRC dyspnea scale
Early diagnosis (spirometry) prevention
Prevent/Rx AECOPD
End-of-life care
Follow-up
Adapted from Can Respir J January/February
200815(suppl A).
4
CTS Recommendations for Optimal COPD Therapy
Increasing Disability and Lung Function Impairment
Mild
Moderate
Severe
Infrequent AECOPD (an average of lt1 per year)
Frequent AECOPD (1 per year)
LAAC or LABA SABA prn
SABA prn
LAAC ICS/LABA SABA prn
persistent disability
persistent disability
persistent disability
LAAC LABA SABA prn
LAAC ICS/LABA SABA prn Theophylline
LAAC SABA prn or LABA SABD prn
persistent disability
LAACICS/LABA SABA prn
Refers to the lower-dose ICS/LABA.
Adapted from Can Respir J January/February
200815(suppl A).
5
Clinical Differences Between Asthma and COPD
Asthma COPD
Age of onset Usually under 40 years Usually over 40 years
Smoking history Not casual Usually gt10 pack-years
Sputum production Infrequent Often
Allergies Often Infrequent
Disease course Stable (with exacerbations) Progressive worsening (with exacerbations)
Spirometry Often normalizes May improve but never normalizes
Clinical symptoms Intermittent and variable Persistent
Adapted from Can Respir J January/February
200815(suppl A).
6
MRC Dyspnea Scale
Grade Description
1 Not troubled by breathlessness except with strenuous exercise
2 Troubled by shortness of breath when hurrying on the level or walking up a slight hill
3 Walks slower than people of the same age on the level because of breathlessness or has to stop for breath when walking at own pace on the level
4 Stops for breath after walking about 90 m or after a few minutes on the level
5 Too breathless to leave the house or breathless when dressing or undressing
Adapted from Can Respir J January/February
200815(suppl A).
7
COPD Is Projected to Be the Third Biggest Cause
of Mortality by 2020
Adapted from Murray CJ, Lopez AD. Lancet
19973491498-504.
8
Inflammation Plays a Central Role in the
Pathogenesis and Pathology of COPD
Cigarette smoke (and other irritants)
Genetic susceptibility
Inflammatory cells Inflammatory mediators
Oxidative stress Proteases
Lung Inflammation
COPD pathology
Mucus hypersecretion
Alveolar wall destruction
Obstructive bronchiolitis
Adapted from Global Initiative for Chronic
Obstructive Lung Disease (GOLD) Guidelines, 2006.
Available at http//www.goldcopd.com/
9
Amplification of Inflammation in COPD
Bacteria Viruses
- Inflammatory cells
- Cytokines
- Mediators
- Proteases
Adapted from Barnes PJ. Personal Communication.
10
Complementary Effect of ICS/LABA on COPD
Inflammation
CD8 T-lymphocytes
Eosinophils
20
8
0
6
20
4
0.87 (3.9 to 5.6)
40
2
-44.67 (-90.9 to 1.6)
-53.4 (-96 to -9)
60
0
Treatment difference (95 CI)
Treatment difference (95 CI)
80
2
-3.1 (-8.0 to 1.8)
-98.05 (-143.1 to -53.0)
100
4
-3.97 (-9 to 1.1)
120
6
140
8
160
10
40
CD68 macrophages
Neutrophils
40
30
30
20
20
18.21 (4.8 to 31.6)
10
0
10
-2.32 (-32.5 to 27.8)
10
Treatment difference (95 CI)
0
Treatment difference (95 CI)
20
-4.57 (-17.6 to 8.5)
-29.36 (-57.8 to -0.9)
10
30
-31.68 (-61.1 to -2.3)
40
20
-22.78 (-35.4 to -10.2)
50
30
60
40
70
SFC-FP
SFC-P
FP-P
SFC-FP
SFC-P
FP-P
SFC-FPsalmeterol/fluticasone DPI vs. fluticasone
DPI SFC-Psalmeterol/fluticasone DPI vs.
placebo FP-Pfluticasone DPI vs. placebo
Adapted from Bourbeau et al. Thorax 2007Epub.
11
Exacerbations Drive Morbidity and Mortality
1. Donaldson et al. Thorax 200257847-52. 2
Donaldson et al. Eur Respir J 200322931-6. 3.
Seemungal et al. Am J Respir Crit Care Med
19981571418-22. 4. Groenewegen et al. Chest
2003124459-67. 5. Soler-Cataluna et al. Thorax
200560925-31.
12
Patients Under-report COPD Exacerbations
Unreported exacerbations
Reported exacerbations
Exacerbations ()
40.1
49.5
59.9
59.9
50.5
1. Seemungal et al. Am J Respir Crit Care Med
19981571418-22.2. Wilkinson et al. Am J Respir
Crit Care Med 20041691298-303.
13
Pulmonary Function Testing COPD
14
GOLD Guidelines
Adapted from GOLD (December 2007).
15
What do COPD patients with a history of
exacerbations want from their therapy?
Quicker symptom relief
55
Patients ()
Results from 1100 interviews in five EU countries
and the USA
Adapted from Miravitlles et al. Respir Med
2007101453-60.
16
Frequent Exacerbations Lead to Declining Lung
Function
Frequent gtmedian 2.92 exacerbations/yearInfreque
nt median 2.92 exacerbations/yearFEV1 forced
expiratory volume in 1 second
Adapted from Donaldson et al. Thorax
200257847-52.
17
Increased Frequency of Exacerbations Increases
the Risk of Mortality in COPD
0 exacerbations 12 exacerbations 3 exacerbations
1.0
0.8
Plt0.0002
0.6
Survival probability
Plt0.0001
P0.069
0.4
0.2
0
Time (months)
Adapted from Soler-Cataluna et al. Thorax
200560925-31.
18
Prolonged Time to First Exacerbation
Plt0.05 Busesonide/formoterol (bud/form) vs. all
other groups (log-rank test)
Budesonide/formoterol prolonged time to first
exacerbation by 100 days vs. LABA alone
Adapted from Calverley et al. Eur Respir J
200322912-9.
19
Therapy at Each Stage of COPD
IV Very Severe
III Severe
II Moderate
I Mild
FEV1/FVC lt 70 FEV1 lt30 predicted or FEV1 lt50 predicted plus chronic respiratory failure
FEV1/FVC lt70 30 FEV1 lt50 predicted
FEV1/FVC lt70 50 FEV1 lt80 predicted
FEV1/FVC lt70 FEV1 80 predicted
FVC forced vital capacity
Adapted from Global Initiative for Chronic
Obstructive Lung Disease (GOLD) Guidelines,
2006. Available from http//www.goldcopd.com/
20
Improvements in Health Status by ICS/LABA
Combinations vs. Placebo
8
7
6
5
Clinically meaningful improvement
? Health status
4
3
2
1
0
Measured by using the St. Georges Respiratory
Questionnaire, a validated tool for measuring
health status in COPD
1. Calverley et al. Eur Respir J 200322912-9
2. Szafranski et al. Eur Respir J
20032174-81. 3. Calverley et al. Lancet
2003361449-56. 4. Calverley et al. N Engl J Med
2007356775-89.
21
ICS/LABA Improves Hospitalization-free Survival
in a Cohort Study
Plt0.05 ICS/LABA vs. ICS or LABARetrospective
cohort analysis of COPD-related rehospitalization
or death within one year of first hospitalization
in 3636 COPD patients receiving ICS and/or LABA
compared with 627 reference patients receiving
SABA alone
Adapted from Soriano et al. Am J Respir Med
2003267-74.
22
ICS/LABA Improves Overall Survivalin a Cohort
Study
1.00
ICS/LABA
LABA
0.95
ICS
SABA
0.90
0.85
Survival function estimate
66 lower relative risk for all-cause mortality
0.80
Hazard ratio 0.34(95 CI, 0.21-0.56)Plt0.001
0.75
0.70
0
200
800
400
600
1200
1000
Survival (days)
Adjusted for age, gender, ICS treatment, LABA
treatment, ICS plus LABA treatment, asthma
diagnosis, measures of COPD severity at baseline,
measures of asthma severity at baseline,
hospitalization for respiratory illnesses, and
both inpatient and outpatient CharlsonDeyo
scores n1685
Adapted from Mapel et al. Respir Med
2006100595-609.
23
Improved Survival with Budesonide / Formoterol
Compared to Bronchodilator Treatment Alone
Adapted from Calverley et al. COPDV 2006.
24
Budesonide/formoterol Maintained Improvement in
Lung Function vs. LABA Alone
Mean FEV1 ( of baseline)
Bud/form
104
Formoterol
102
Budesonide
100
Placebo
98
96
94
92
90
88
86
84
82
80
0
1
2
3
4
5
6
7
8
9
10
11
12
0.5
Time from randomization (months)
Plt0.001 Budesonide/formoterol (bud/form) vs.
placebo and budesonide P0.002 Budesonide/formoter
ol vs. formoterol Plt0.001 formoterol vs. placebo
Calverley et al. Eur Respir J 200322912-9.
25
Reduced Rate of Exacerbations Requiring Medical
Intervention vs. LABA Alone
5
Rate of exacerbations/patient/year
0
3
5
2.1
2
10
Number needed to treat
15
1
20
0
25
24
Budesonide/ formoterol vs. formoterol
30
Bud/form
Budesonide
Formoterol
- Treating 100 patients with COPD (GOLD stage
IIIIV) with budesonide/formoterol instead of
formoterol alone may prevent 47 exacerbations in
one year
Plt0.05 vs. placebo P0.015 budesonide/formotero
l (bud/form) vs. formoterol
Adapted from Calverley et al. Eur Respir J
200322912-9.
26
Lower Health Status Predicts Mortality
SGRQSt. Georges Respiratory QuestionnaireHigher
health statusSGRQ total score 60 lower health
statusSGRQ total score gt60
Adapted from Gudmundsson et al. Respir Res
20067109.
27
Mortality Stratified by Median Baseline SGRQ
Total Score
0.10
0.08
SGRQ total score gt50
0.06
Proportion of patients who died
0.04
SGRG total score gt50
SGRQ total score 50
0.02
SGRQ total score 50
0
0
360
320
280
240
200
160
120
80
40
400
Time in study (days)
Stratified by SGRQ total score, median 50-unit
cut-off
Adapted from Calverley et al. COPDV 2006.
28
Impact of Smoking Cessation Programmes on
Mortality
1.00 0.95 0.90 0.85 0.80
Proportion of patients with no event
15
0
1
2
3
4
5
6
7
8
9
10
11
12
13
14
15
Time since LHS baseline (years)
- All-cause 14.5-year survival from the Lung Health
Study (LHS)
Adapted from Anthonisen et al. Ann Intern Med
2005142233-9.
29
ICS Improve Hospitalization-free Survivalin a
Cohort Study
Adapted from Sin et al. Am J Respir Crit Care Med
2001164580-4.
30
ISEEC Study ICS Improve Survival
ISEECInhaled Steroids Effects Evaluation in
COPD Stratified by individual trials and
adjusted for age, gender, baseline
post-bronchodilator FEV1 ( predicted normal),
baseline smoking status and body mass index
n5085
Adapted from Sin et al. Thorax 200560992-7.
31
EUROSCOP Study Design
- Primary end point change over time in FEV1
- Patients aged 30-65 years, current smokers
(smoking history of - 5 pack-years), FEV1 50-100 predicted normal,
FEV1/VC lt70
Patients who continued to smoke after two
three-month smoking cessation programmes and were
75 compliant with the recommended treatment
regimens were randomized. VCvital capacity
Adapted from Pauwels et al. N Engl J Med
19993401948-53.
32
TORCH Further Evidence that ICS/LABA Can Reduce
Mortality in COPD
Month
- Primary end point all-cause mortality over three
years
Adapted from Vestbo et al. Eur Respir J
200424206-10. Calverley et al. N Engl J
Med 2007356775-89.
33
TORCH All-cause Mortality at Three Years
Vertical bars represent standard errors
Adapted from Calverley et al. N Engl J Med
2007356775-89.
34
Health Related QOL Over 3 Years - TORCH
Plt0.001 SAL/FP vs. Placebo over 3 years
Plt0.001 SAL/FP vs. SAL over 3 years
3
P0.017 SAL/FP vs. FP over 3 years
2
1
0
Adjusted mean change in SGRQ total score
-1
-2
Improvement
-3
-4
-5
0
24
48
72
96
120
156
Week
Vertical bars represent standard errors
Adapted from Calverley et al. N Engl J Med
2007356775-89.
35
Improvements in Post Bronchodilator FEV1with
SAL/FP 500/50 over 3 years - TORCH
Plt 0.001 SAL/FP vs. Placebo over 3 years
Plt 0.001 SAL/FP vs. SAL and FP over 3 years
SAL/FP 500/50
Placebo
SAL
FP
100
Rate of decline (mL /yr)
-55
-42
-42
-39
P-value vs. placebo
50
0.003
0.003
lt0.001
0
Adjusted Mean Change FEV1 (mL)
-50
-100
-150
0
24
48
72
96
120
156
Time (Weeks)
SAL/FP 500/50
SAL
Placebo
FP
Adapted from Calverley et al. N Engl J Med 2007
356 775-89.
36
Rationale for TORCH ICS with LABA
Probability of survival
Survival was significantly higher at year 3 in
patients receiving SAL/FP than in the reference
group
1.0
0.9
0.8
1045
0.7
SAL FP
FP
3620
SAL
0.6
Reference (no ICS or LABA)
0
0
6
12
18
24
30
36
Follow-up (months)
SAL/FPsalmeterol/fluticasone
Adapted from Soriano et al. Eur Respir J
200220(4)819-25.
Recommended
